个人收入与支出:2026年8月
Personal Income and Outlays, August 2026
以下为原文逐段中文翻译,保留图表与说明。AI 翻译并经 AI 对照复核,仍可能存在错误;核对数据和引用时请同时查看原文。译文发布:2026年10月5日 22:59(北京时间)。
美国经济分析局(BEA)本次发布的估算显示,8月个人收入增加666亿美元,月度增幅为0.2%。可支配个人收入(DPI,即个人收入减去个人当期税款)增加686亿美元,增幅为0.3%;个人消费支出(PCE)增加1908亿美元,增幅为0.9%。
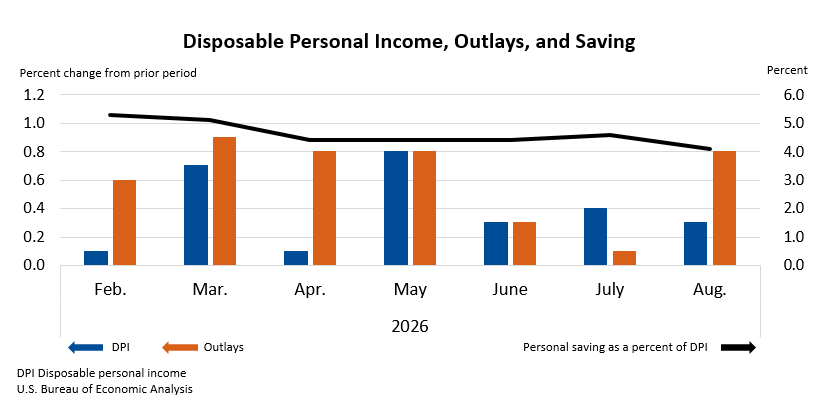
8月个人支出增加1907亿美元。个人支出是个人消费支出、个人利息支出和个人经常转移支付之和。个人储蓄为9902亿美元,个人储蓄率为4.1%;个人储蓄率指个人储蓄占可支配个人收入的比例。
8月按现价计算的个人收入增长,主要反映雇员报酬和政府社会福利的增加。
8月按现价计算的个人消费支出增加1908亿美元,其中商品支出增加1141亿美元,服务支出增加767亿美元。
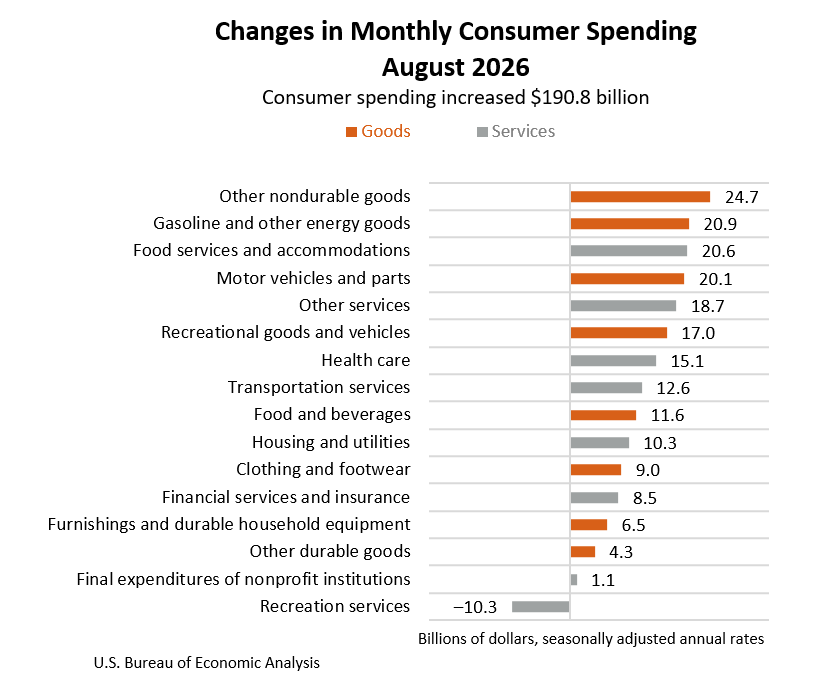
8月实际个人消费支出增加928亿美元,月度增幅为0.6%。
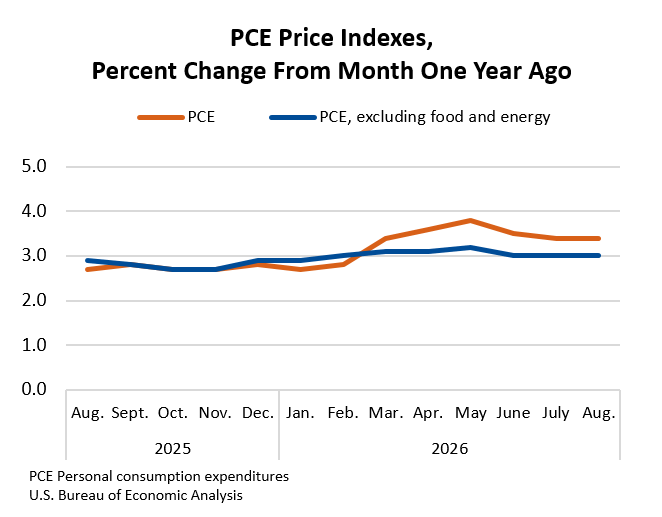
与上月相比,8月个人消费支出价格指数上涨0.3%;剔除食品和能源后,该指数上涨0.2%。
与上年同月相比,8月个人消费支出价格指数上涨3.4%;剔除食品和能源后,该指数同比上涨3.0%。
- 个人收入及相关指标[较上月的百分比变化]
- 7月 · 8月
- 按现价计算的个人收入 · 0.3 · 0.2
- 按现价计算的可支配个人收入(DPI) · 0.4 · 0.3
- 实际可支配个人收入(DPI) · 0.3 · 0.0
- 按现价计算的个人消费支出(PCE) · 0.1 · 0.9
- 实际个人消费支出(PCE) · 0.1 · 0.6
- 个人消费支出价格指数 · 0.1 · 0.3
- 剔除食品和能源的个人消费支出价格指数 · 0.1 · 0.2
国民经济核算年度更新
本次发布给出了国民经济核算年度更新后的月度结果。个人收入与支出估算的修订从2021年1月起算。详情请参阅《2026年全国、行业、州和县统计年度更新说明》。
有关定义、统计惯例、个人收入与支出数据更新,以及这些统计数据的更多说明,请参阅“补充信息”。
下次发布:2026年10月29日美国东部夏令时间上午8:30,发布《个人收入与支出:2026年9月》。
技术说明
8月个人收入与支出的变化
8月个人收入增加666亿美元,主要反映雇员报酬和政府社会福利的增加。
- 在雇员报酬中,增长主要来自私营部门的工资和薪金,数据依据为美国劳工统计局(BLS)的当前就业统计(CES)。
- 在政府社会福利中,增长主要来自联邦医疗保险(Medicare)和社会保障福利,数据依据为《财政部月度报告》和《美国政府预算》。
个人收入数据修订
2026年1月至3月的雇员报酬月度估算纳入了美国劳工统计局“季度就业与工资普查”项目的第一季度工资和薪金数据,并据此进行修订。2026年4月至7月的工资和薪金估算也已更新,以反映该局当前就业统计项目修订后的月度数据。医疗补助(Medicaid)福利的修订反映了美国医疗保险和医疗补助服务中心提供的最新信息。
相关数据表
本次发布重点介绍的统计数据及其历史时间序列,见BEA交互式数据应用中的下列数据表。
表2.6:个人收入及其使用;表2.8.1:按主要产品类别划分的实际个人消费支出较上期的百分比变化;表2.8.5:按主要产品类别划分的个人消费支出;表2.8.6:按主要产品类别划分的实际个人消费支出;表2.8.7:按主要产品类别划分的个人消费支出价格较上期的百分比变化;表2.8.11:按主要产品类别划分的实际个人消费支出较上年同月的百分比变化。
注:下次数据发布后,本次数据将被新数据取代,上述链接也将显示最新数据。届时,本次发布的原始数据可通过BEA数据档案访问。
展开英文原文 · 与中文逐段对应
Personal Income and Outlays, August 2026
Personal income increased $66.6 billion (0.2 percent at a monthly rate) in August, according to estimates released today by the U.S. Bureau of Economic Analysis (BEA). Disposable personal income (DPI) —personal income less personal current taxes—increased $68.6 billion (0.3 percent), and personal consumption expenditures (PCE) increased $190.8 billion (0.9 percent).
Personal outlays —the sum of PCE, personal interest payments, and personal current transfer payments—increased $190.7 billion in August. Personal saving was $990.2 billion, and the personal saving rate —personal saving as a percentage of DPI—was 4.1 percent.
The increase in current-dollar personal income in August primarily reflected increases in compensation and government social benefits.
The $190.8 billion increase in current-dollar PCE in August reflected increases of $114.1 billion in spending on goods and $76.7 billion in spending on services.
Real PCE increased $92.8 billion ( 0.6 percent at a monthly rate) in August.
From the preceding month, the PCE price index for August increased 0.3 percent . Excluding food and energy, the PCE price index increased 0.2 percent.
From the same month one year ago, the PCE price index for August increased 3.4 percent . Excluding food and energy, the PCE price index increased 3.0 percent from one year ago.
- Personal Income and Related Measures[Percent change from preceding month]
- July · August
- Current-dollar personal income · 0.3 · 0.2
- Current-dollar DPI · 0.4 · 0.3
- Real DPI · 0.3 · 0.0
- Current-dollar PCE · 0.1 · 0.9
- Real PCE · 0.1 · 0.6
- PCE price index · 0.1 · 0.3
- PCE price index excluding food and energy · 0.1 · 0.2
Annual Update of the National Economic Accounts
Today’s release presents monthly results from the annual update of the National Economic Accounts. The revisions for estimates of personal income and outlays begin with January 2021. Refer to " Information on 2026 Annual Updates to the National, Industry, State, and County Statistics " for more information.
For definitions, statistical conventions, updates to personal income and outlays, and more information about these statistics, visit “ Additional Information .”
Next release: October 29, 2026, at 8:30 a.m. EDT Personal Income and Outlays, September 2026
Technical Notes
Changes in personal income and outlays for August
The August increase of $66.6 billion in personal income primarily reflected increases in compensation and government social benefits.
- Within compensation, the increase was led by private wages and salaries based on U.S. Bureau of Labor Statistics (BLS) Current Employment Statistics (CES).
- Within government social benefits, the leading contributors to the increase were Medicare and social security benefits, based on data from the Monthly Treasury Statement and the Budget of the U.S. Government.
Revisions to personal income
Monthly estimates for compensation for January through March of 2026 include revisions resulting from the incorporation of first-quarter wage and salary data from the BLS Quarterly Census of Employment and Wages program. Estimates for wages and salaries for April through July of 2026 have been updated to reflect revised monthly data from the BLS CES program. The revision to Medicaid benefits reflects updated information from the Centers for Medicare & Medicaid Services.
Related Data Tables
For the statistics highlighted in this release, as well as historical time series for these estimates, see the following data tables in BEA’s Interactive Data Application .
Table 2.6. Personal Income and Its Disposition Table 2.8.1. Percent Change From Preceding Period in Real PCE by Major Type of Product Table 2.8.5. PCE by Major Type of Product Table 2.8.6. Real PCE by Major Type of Product Table 2.8.7. Percent Change From Preceding Period in Prices for PCE by Major Type of Product Table 2.8.11. Real PCE by Major Type of Product: Percent Change From Month One Year Ago
Note. With the next release, today’s data will be superseded, and the links above will reflect the latest data. The original data featured in this release can then be accessed in BEA’s Data Archive .
查看本期独立摘要
中文独立摘要 · AI 整理
这件事
美国 BEA 于 9 月 30 日发布的数据显示,8 月 PCE 价格指数环比上涨 0.3%、同比上涨 3.4%;剔除食品和能源后,核心指标环比上涨 0.2%、同比上涨 3.0%。
本页概括所列来源的重点,属于独立摘要;完整报道请阅读原站。整理时间:2026年10月5日 23:11(北京时间)。
信息从哪里来
直接依据美国 BEA 原始统计发布正文。数据所属期为 8 月,报告发布于 9 月 30 日。
- 美国 BEA 美国 BEA · 原始统计发布