2026年第二季度美国国际交易与投资头寸
U.S. International Transactions and Investment Position, 2nd Quarter 2026
以下为原文逐段中文翻译,保留图表与说明。AI 翻译并经 AI 对照复核,仍可能存在错误;核对数据和引用时请同时查看原文。译文发布:2026年10月6日 18:02(北京时间)。
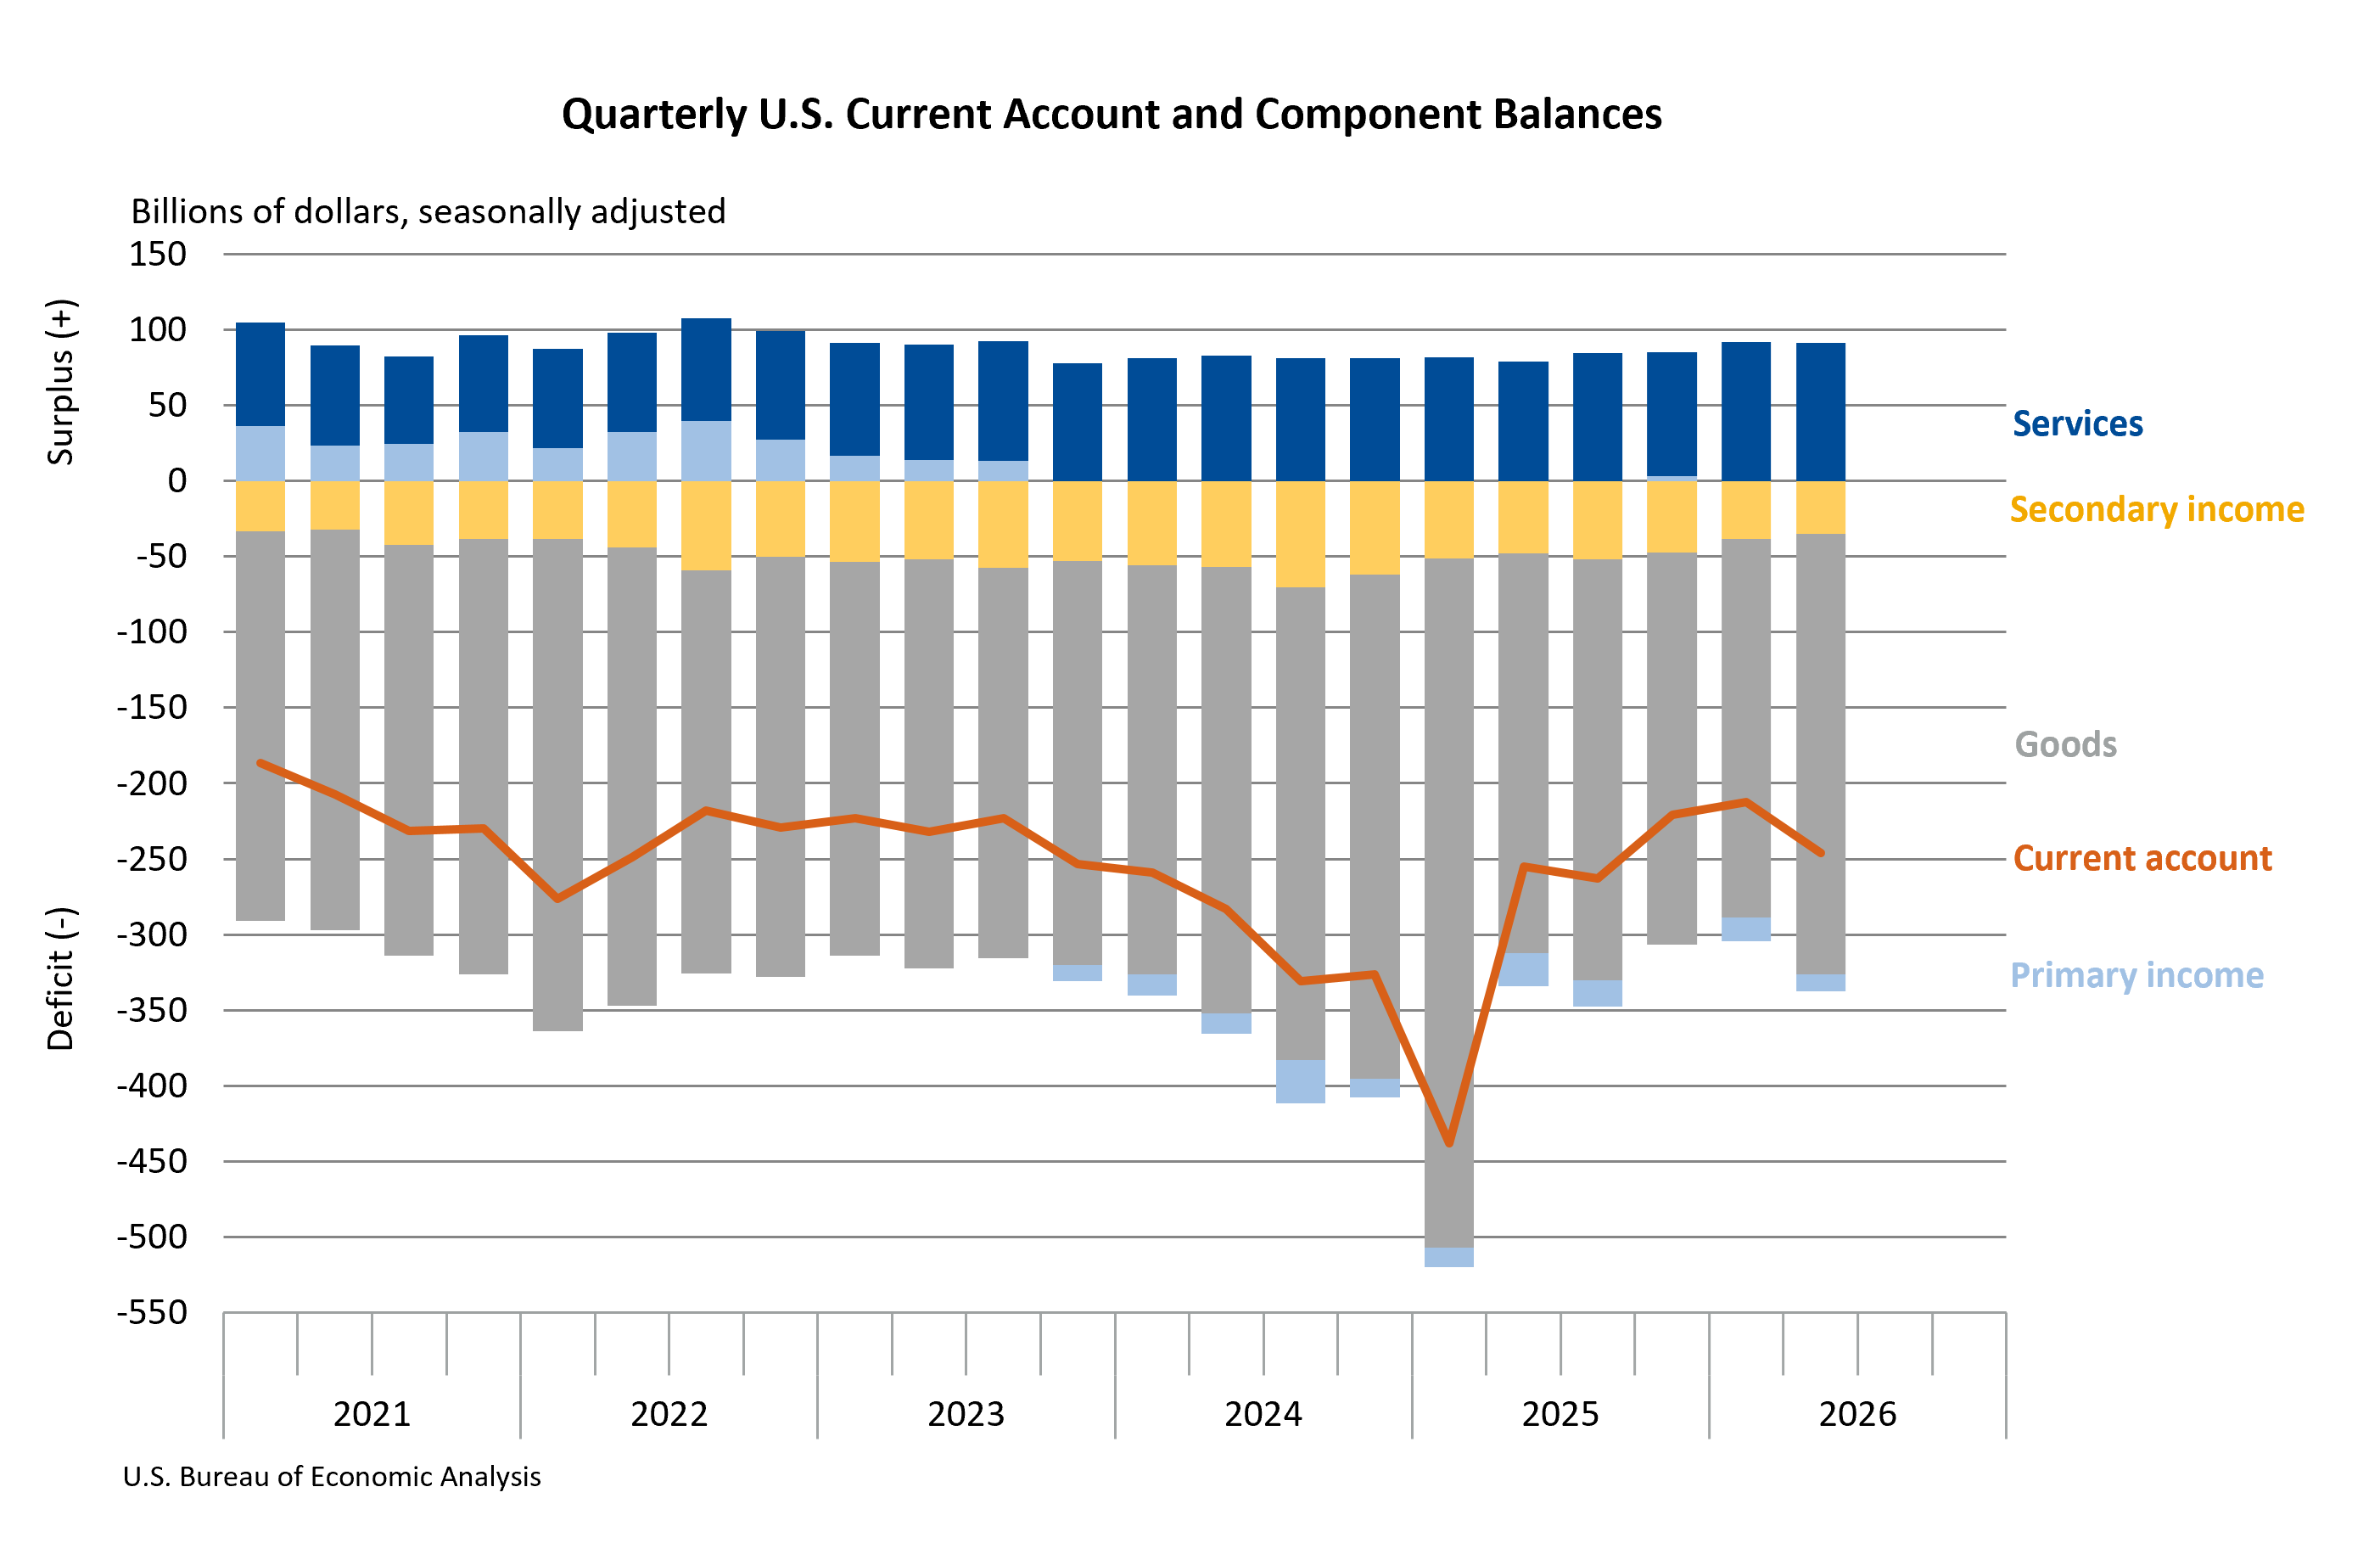
根据美国经济分析局今天公布的统计数据,2026年第二季度,美国国际经济交易产生的经常账户赤字扩大334亿美元,增幅为15.7%,达到2460亿美元。经修订,第一季度赤字为2126亿美元。
第二季度赤字占现价国内生产总值的3.0%,高于第一季度的2.7%。
第二季度经常账户赤字扩大334亿美元,反映了货物贸易赤字的扩大;初次收入(所得)和二次收入(经常转移)赤字缩小,部分抵消了这一影响。
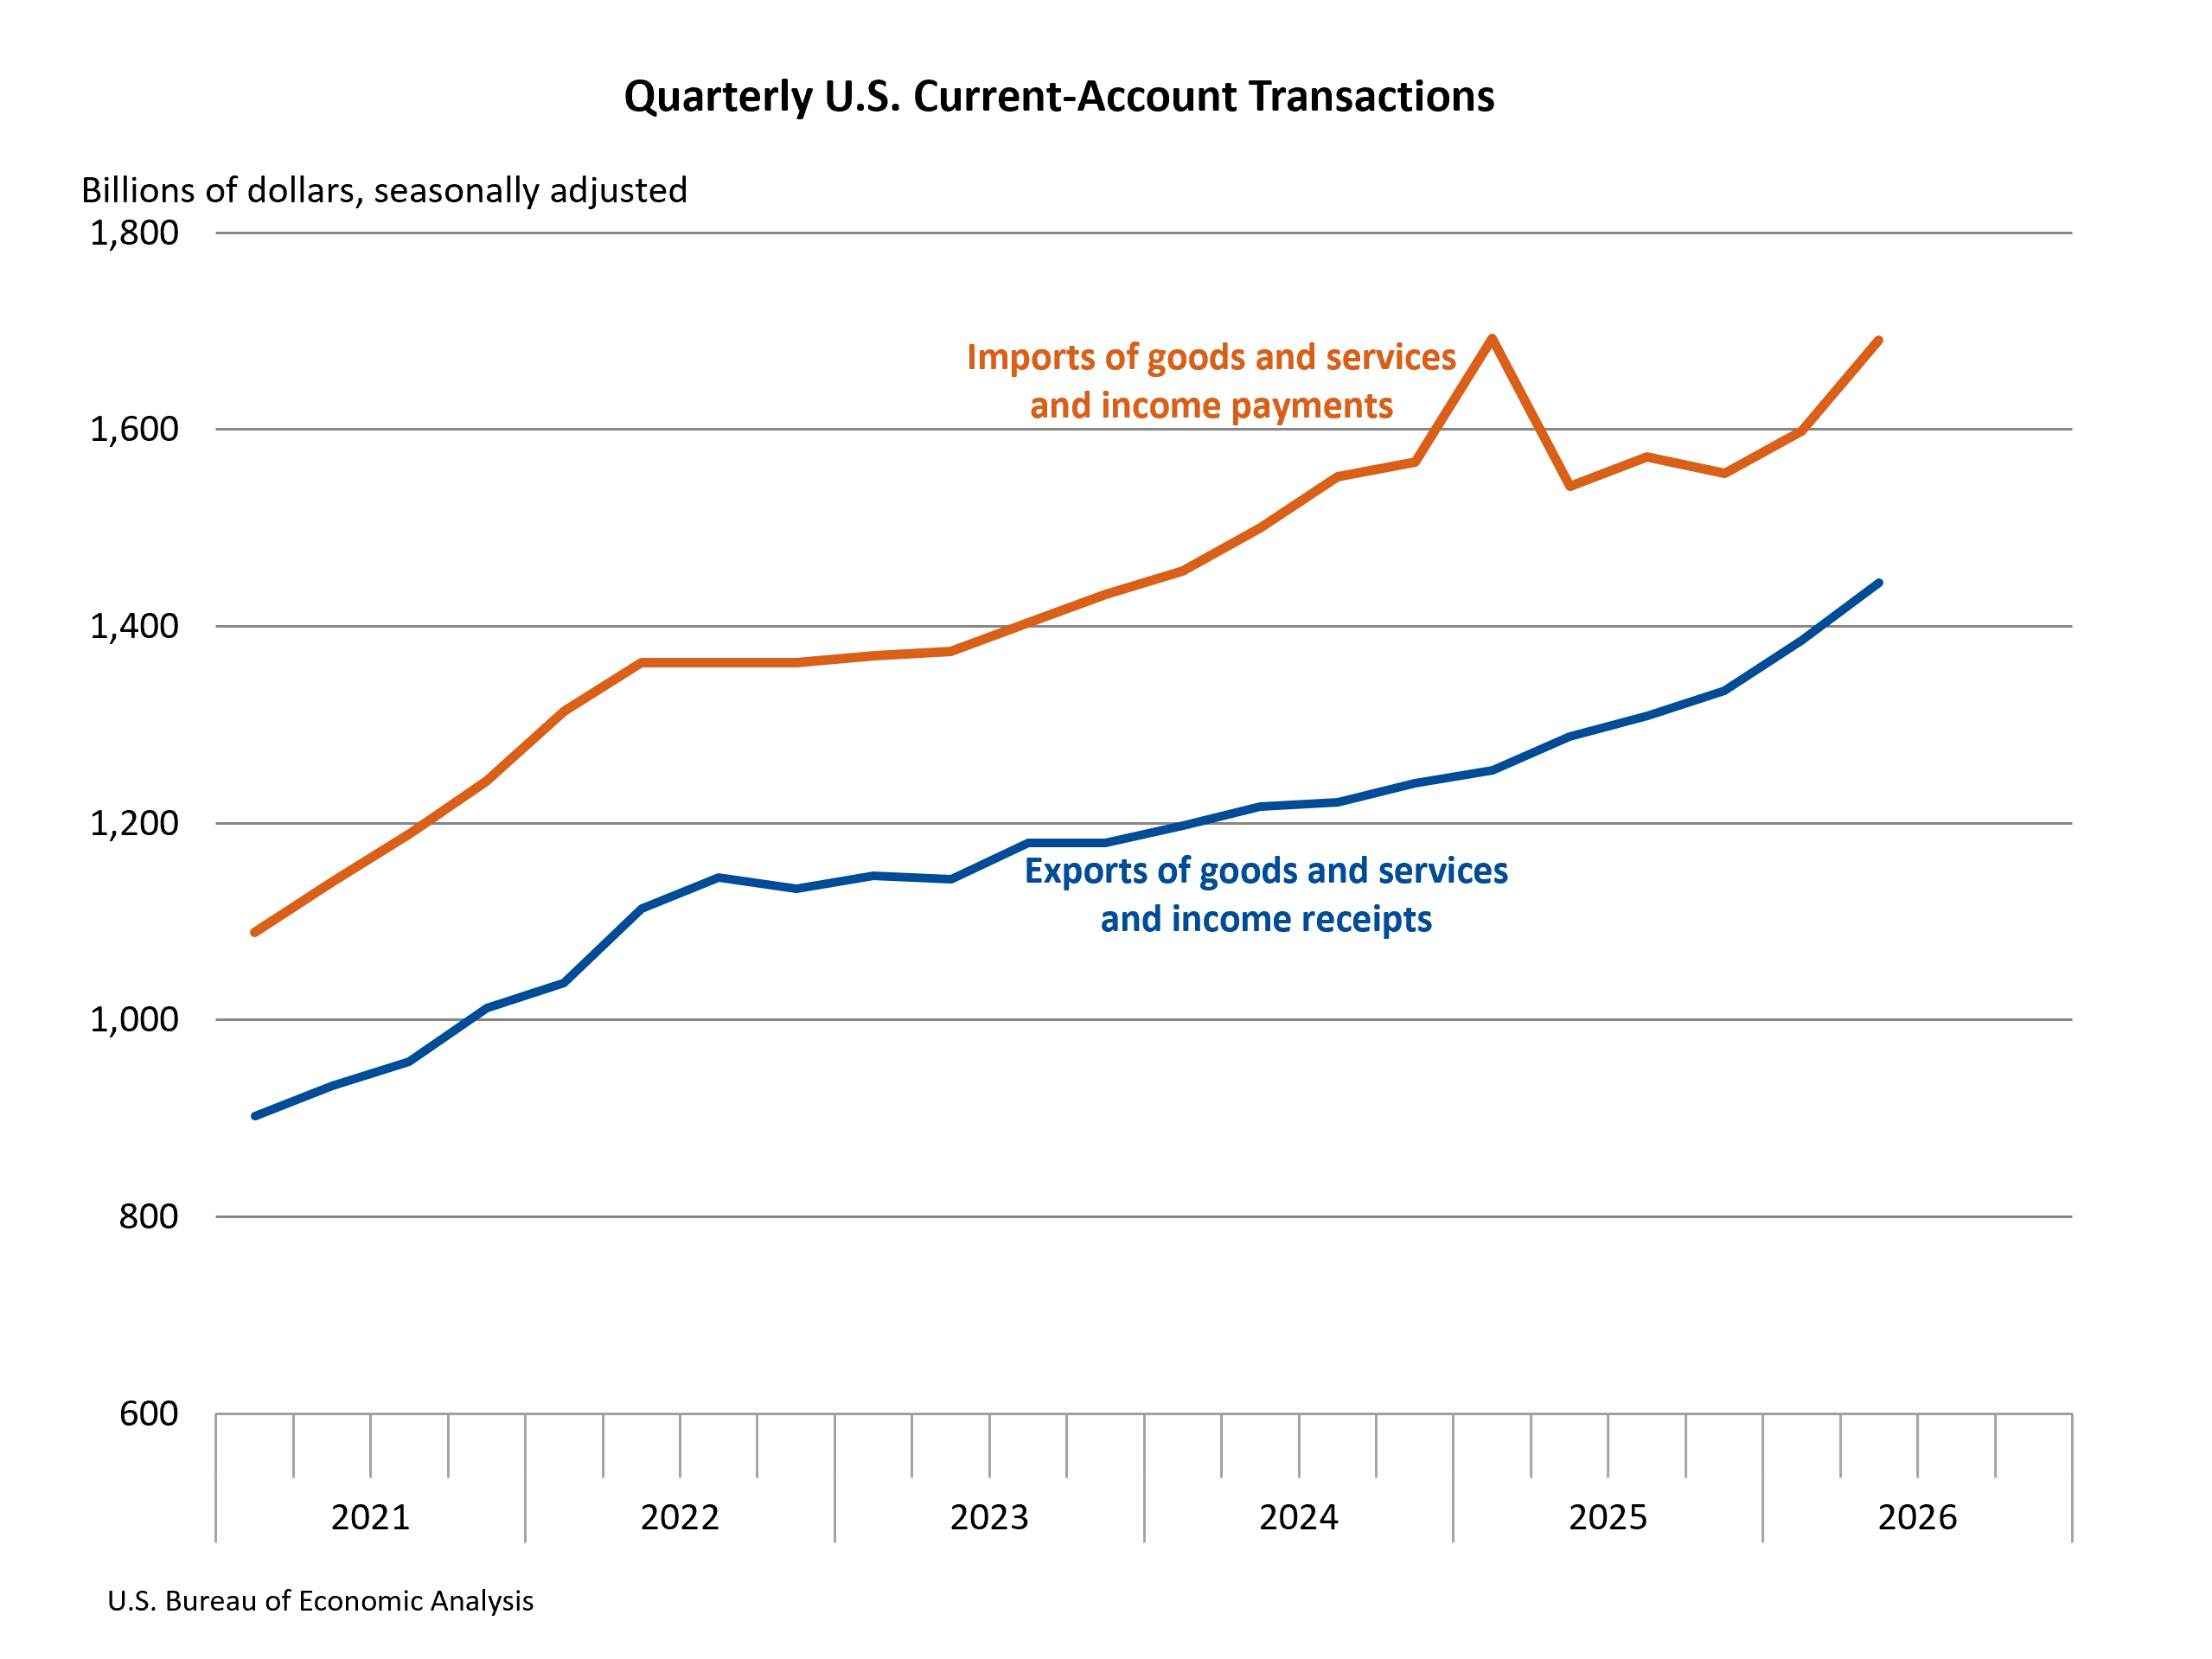
第二季度,对外国居民的货物和服务出口以及从外国居民获得的收入合计增加588亿美元,达到1.44万亿美元,反映了货物出口和初次收入(所得)项下收入的增加。
从外国居民进口的货物和服务以及向外国居民支付的收入合计增加922亿美元,达到1.69万亿美元,反映了货物进口和初次收入(所得)项下支出的增加。
第二季度,资本转移收入减少11亿美元,降至23亿美元。资本转移支出减少9亿美元,降至10亿美元。
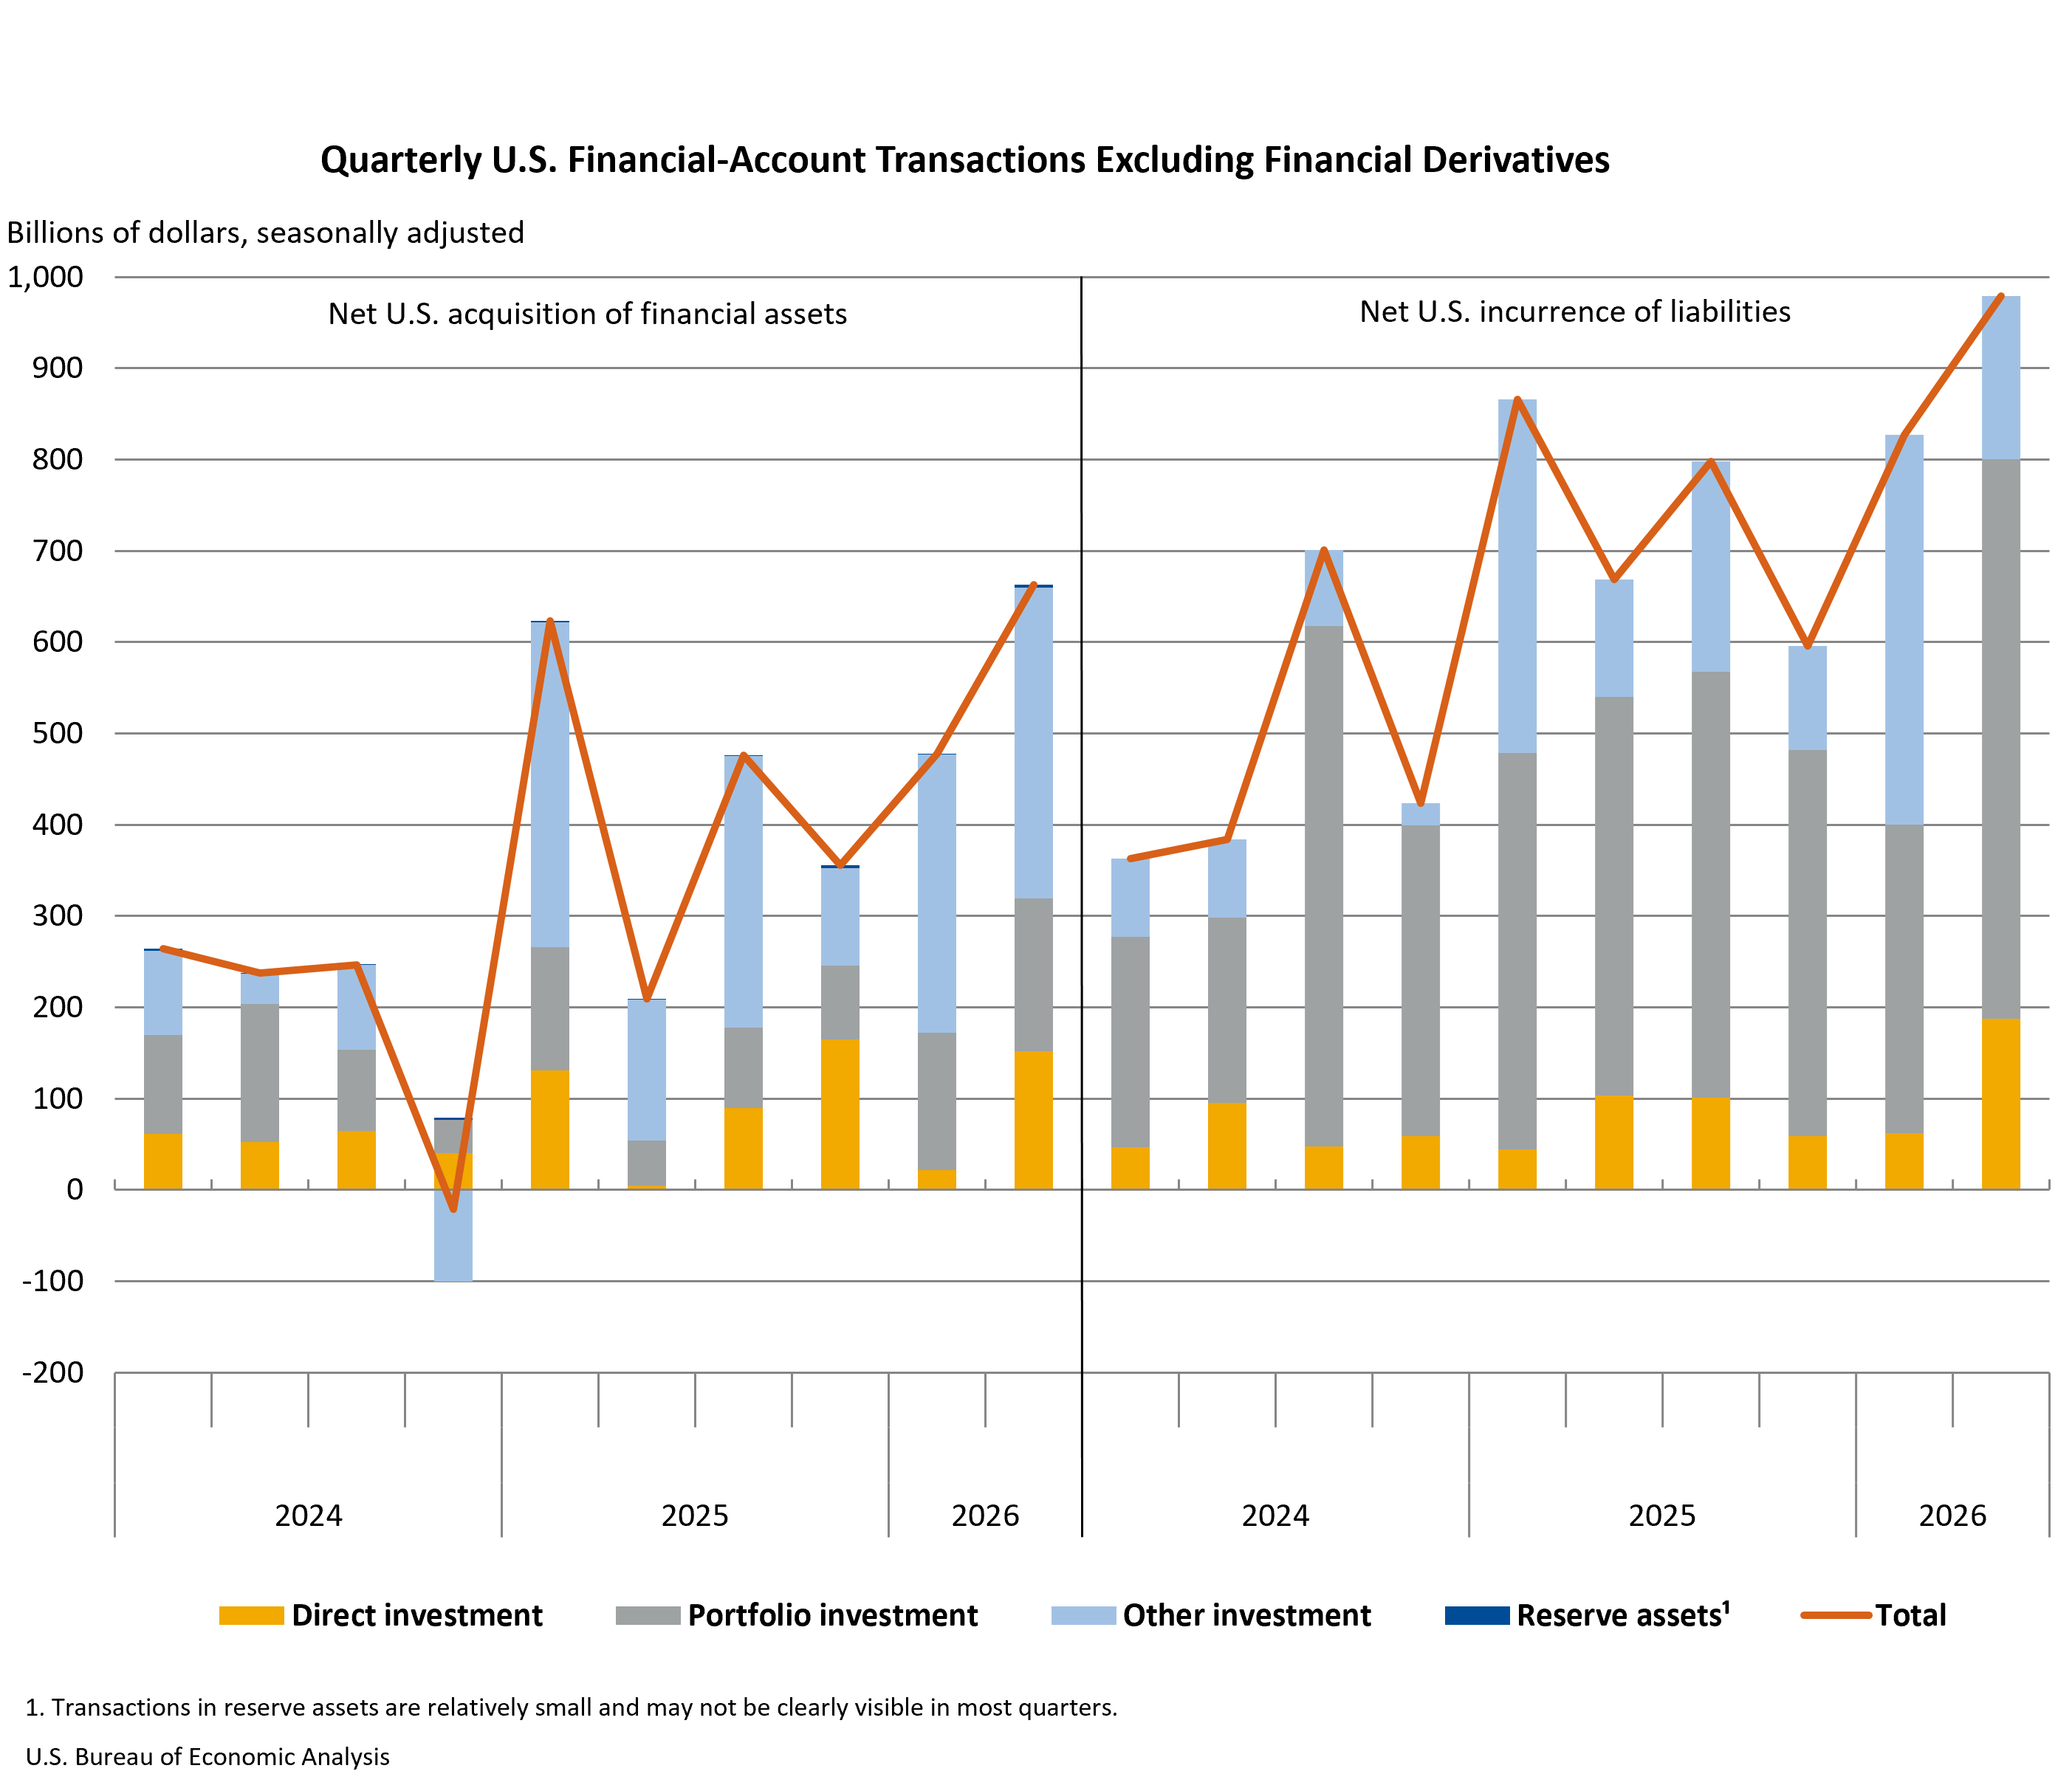
第二季度,金融账户交易净额为–3697亿美元,反映出美国从外国居民净借入资金。〔1〕第二季度的交易使美国居民的对外金融资产增加6633亿美元,并使美国对外国居民的负债增加9789亿美元。
截至2026年第二季度末,美国净国际投资头寸,即美国居民对外金融资产与负债之差,为–22.42万亿美元。资产总额为46.97万亿美元,负债总额为69.39万亿美元。截至2026年第一季度末,净投资头寸为–21.27万亿美元(修订值)。
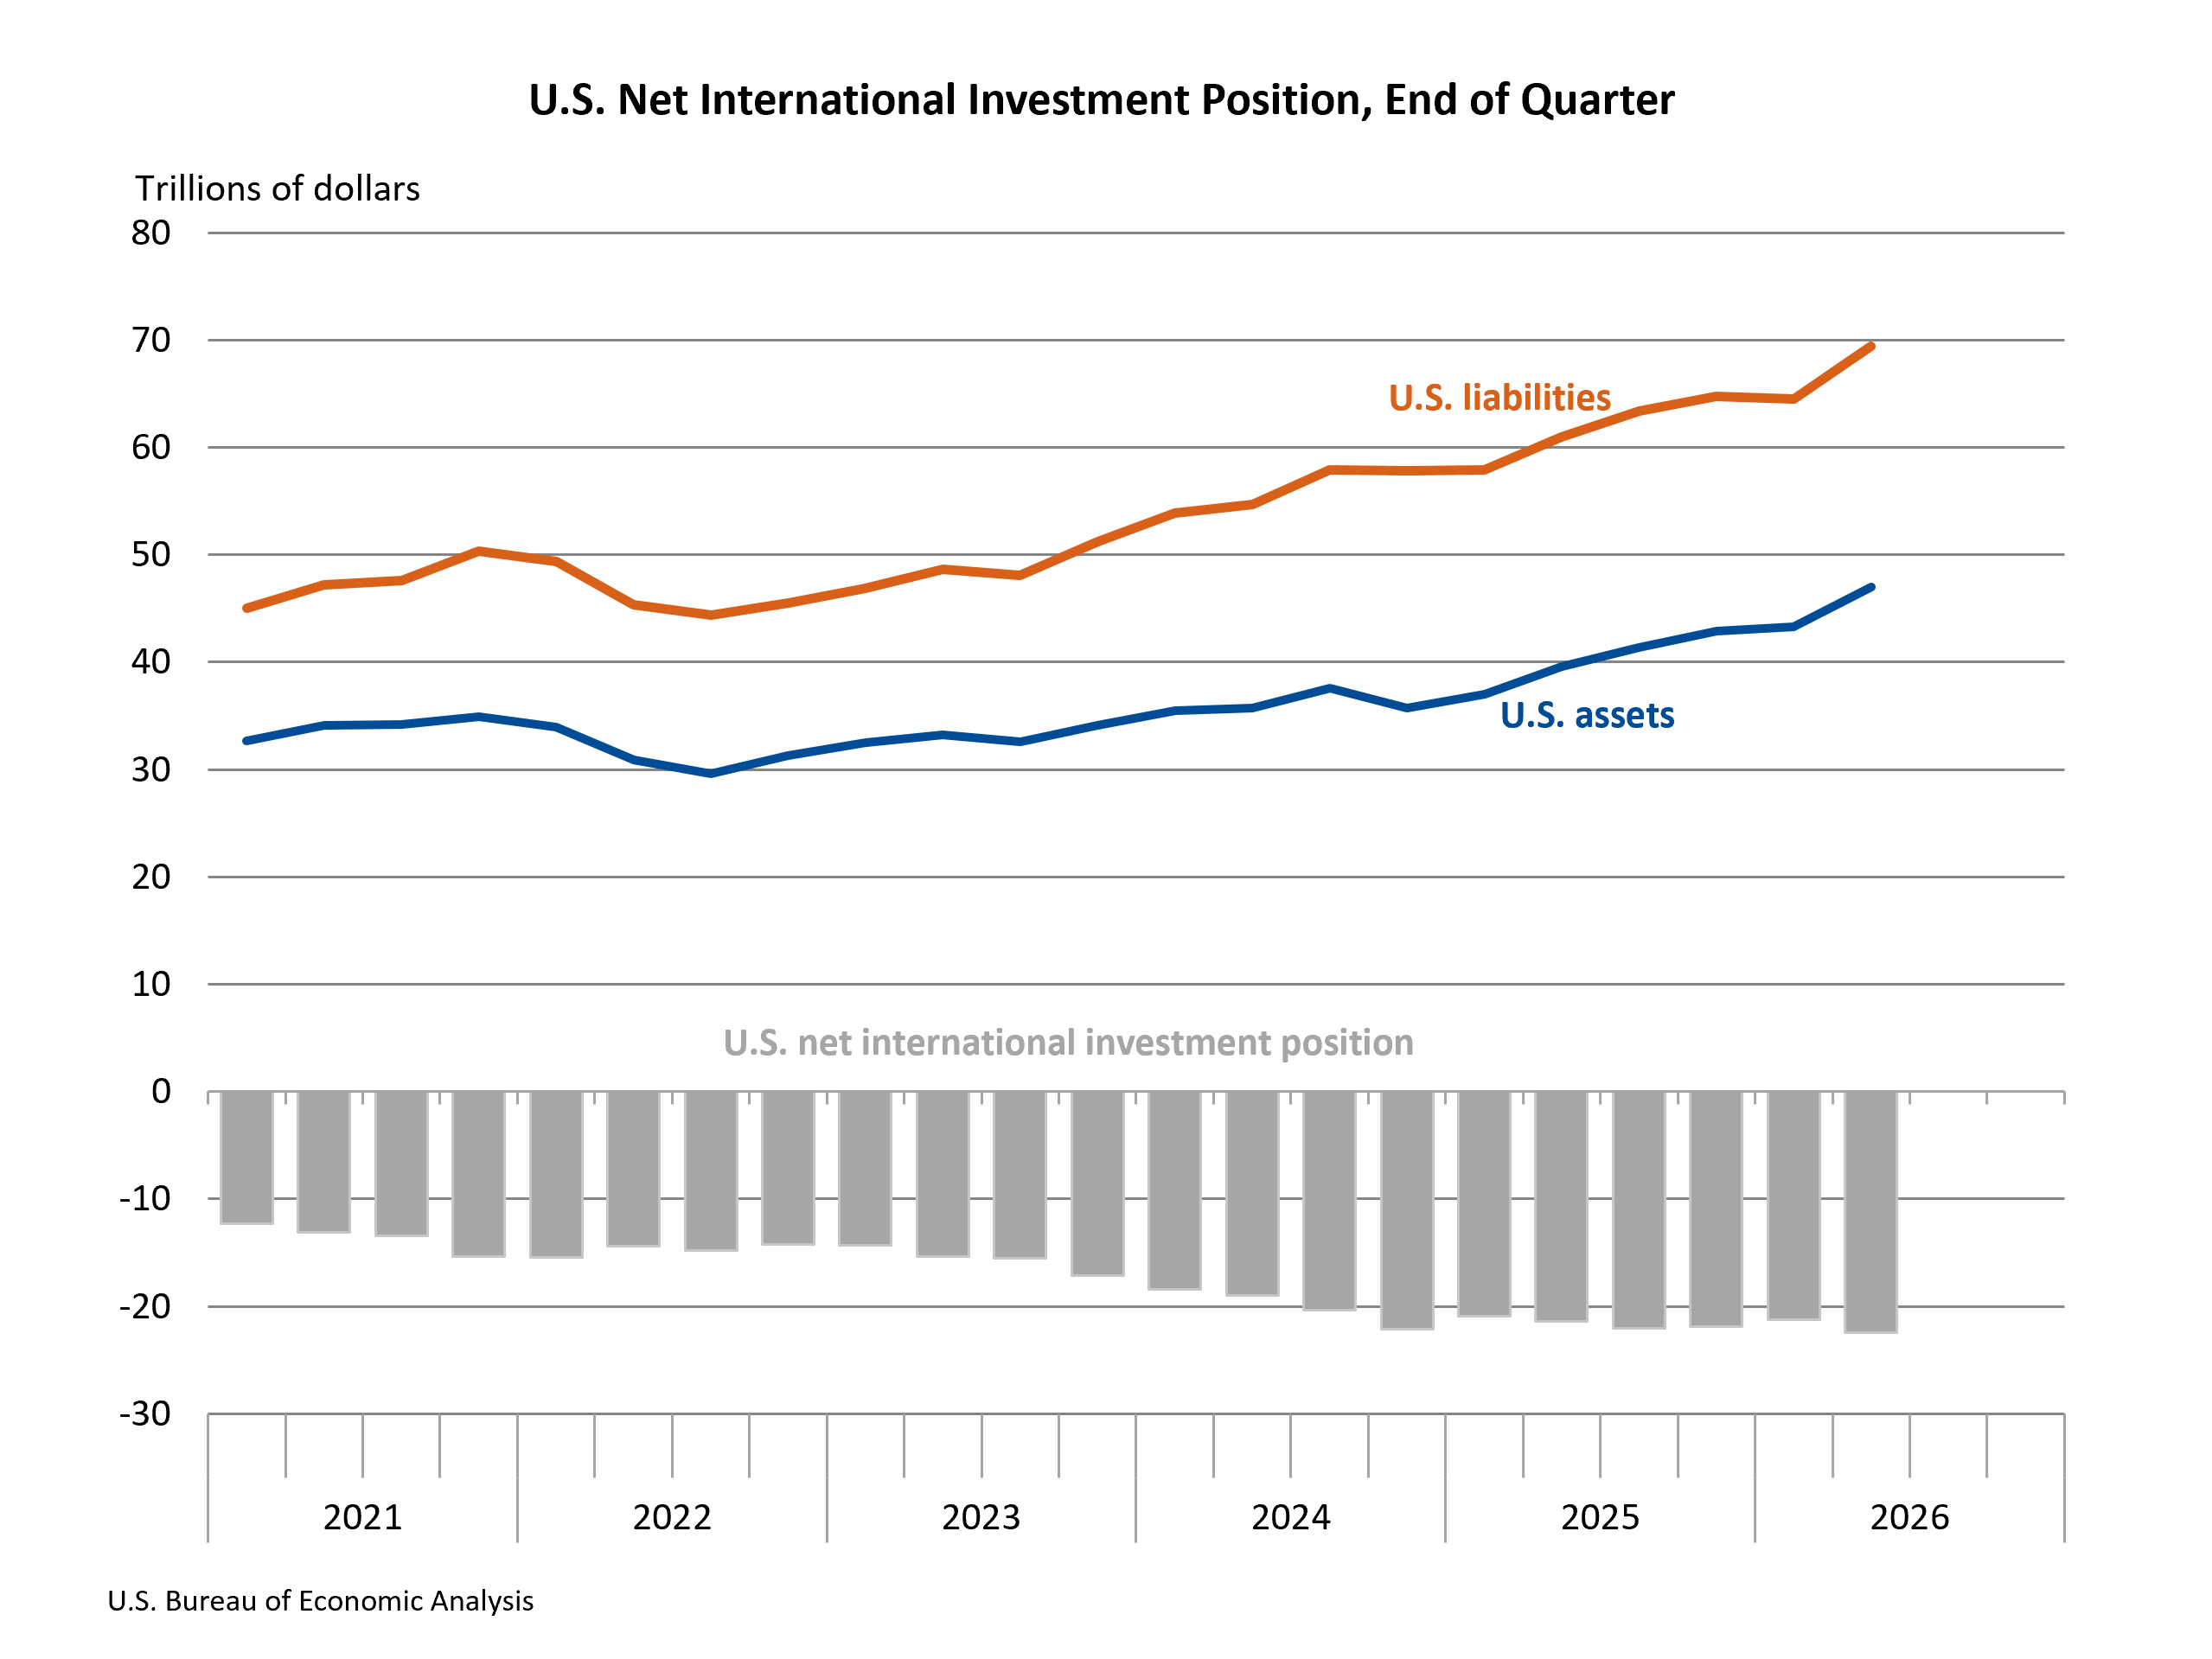
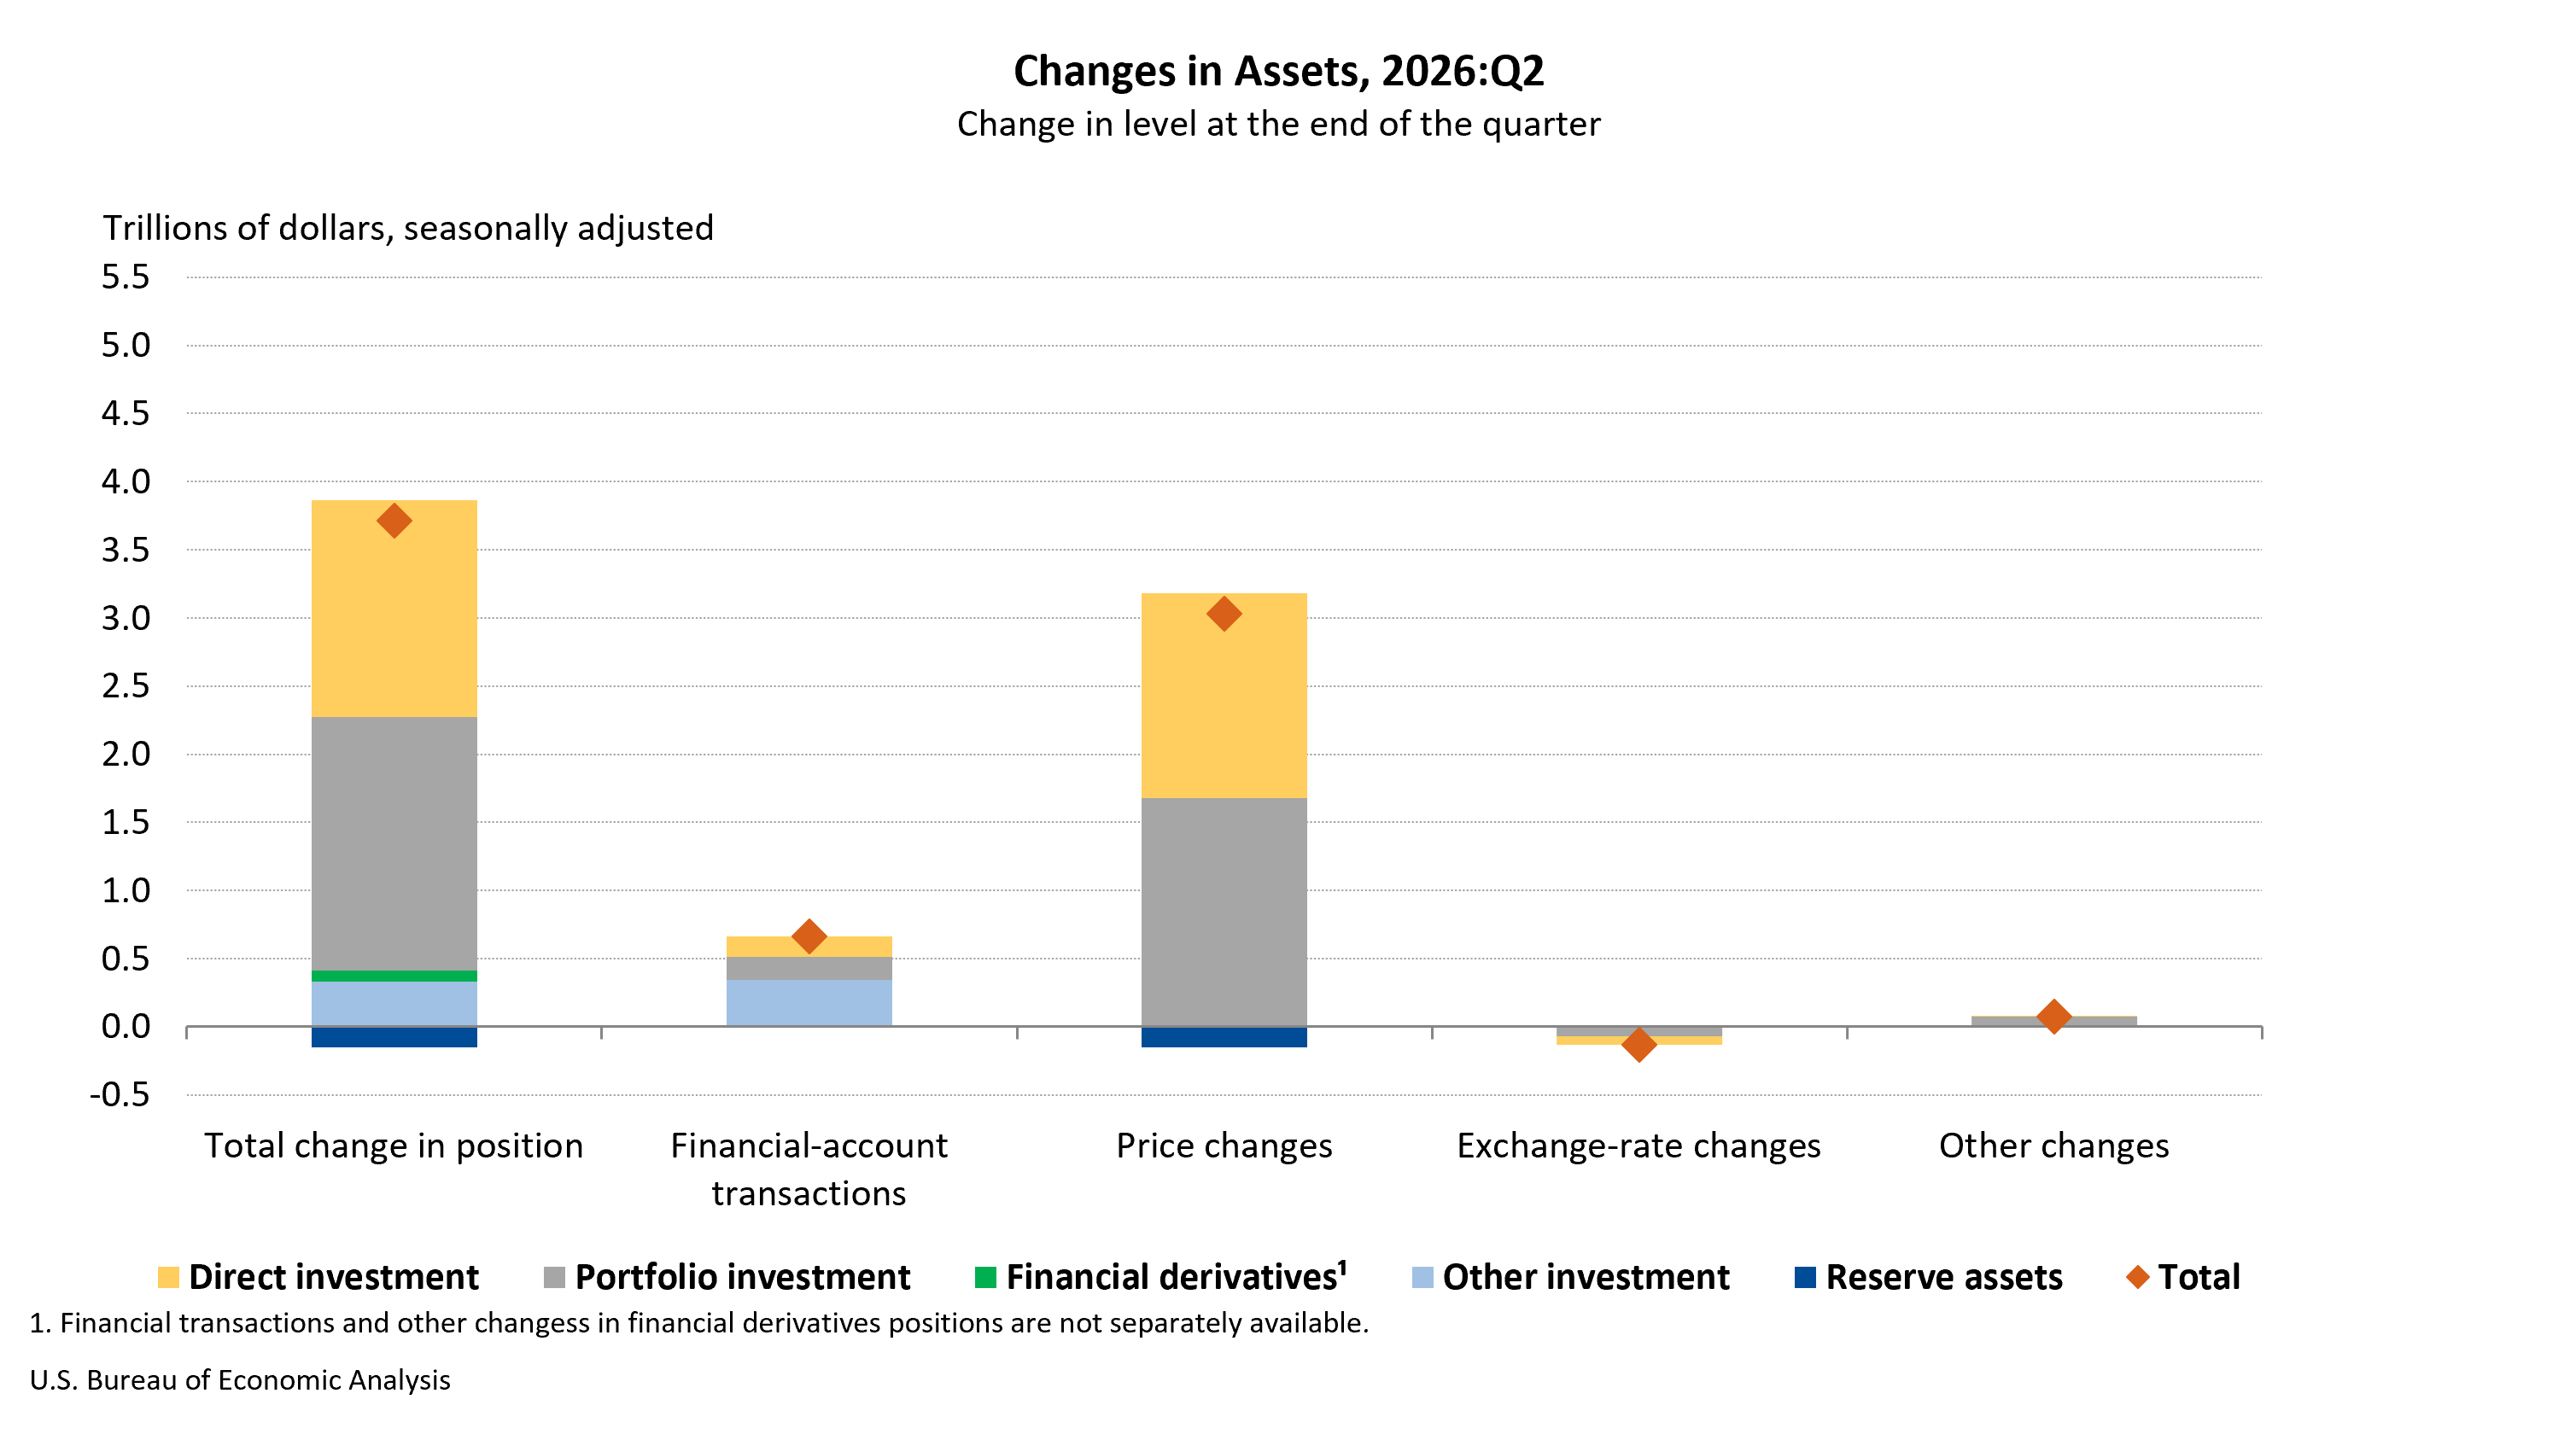
第二季度,美国资产增加3.72万亿美元,反映了除储备资产以外所有主要投资类别的增长。总体增长主要由价格变动带来的3.03万亿美元增量和6633亿美元的金融交易推动。
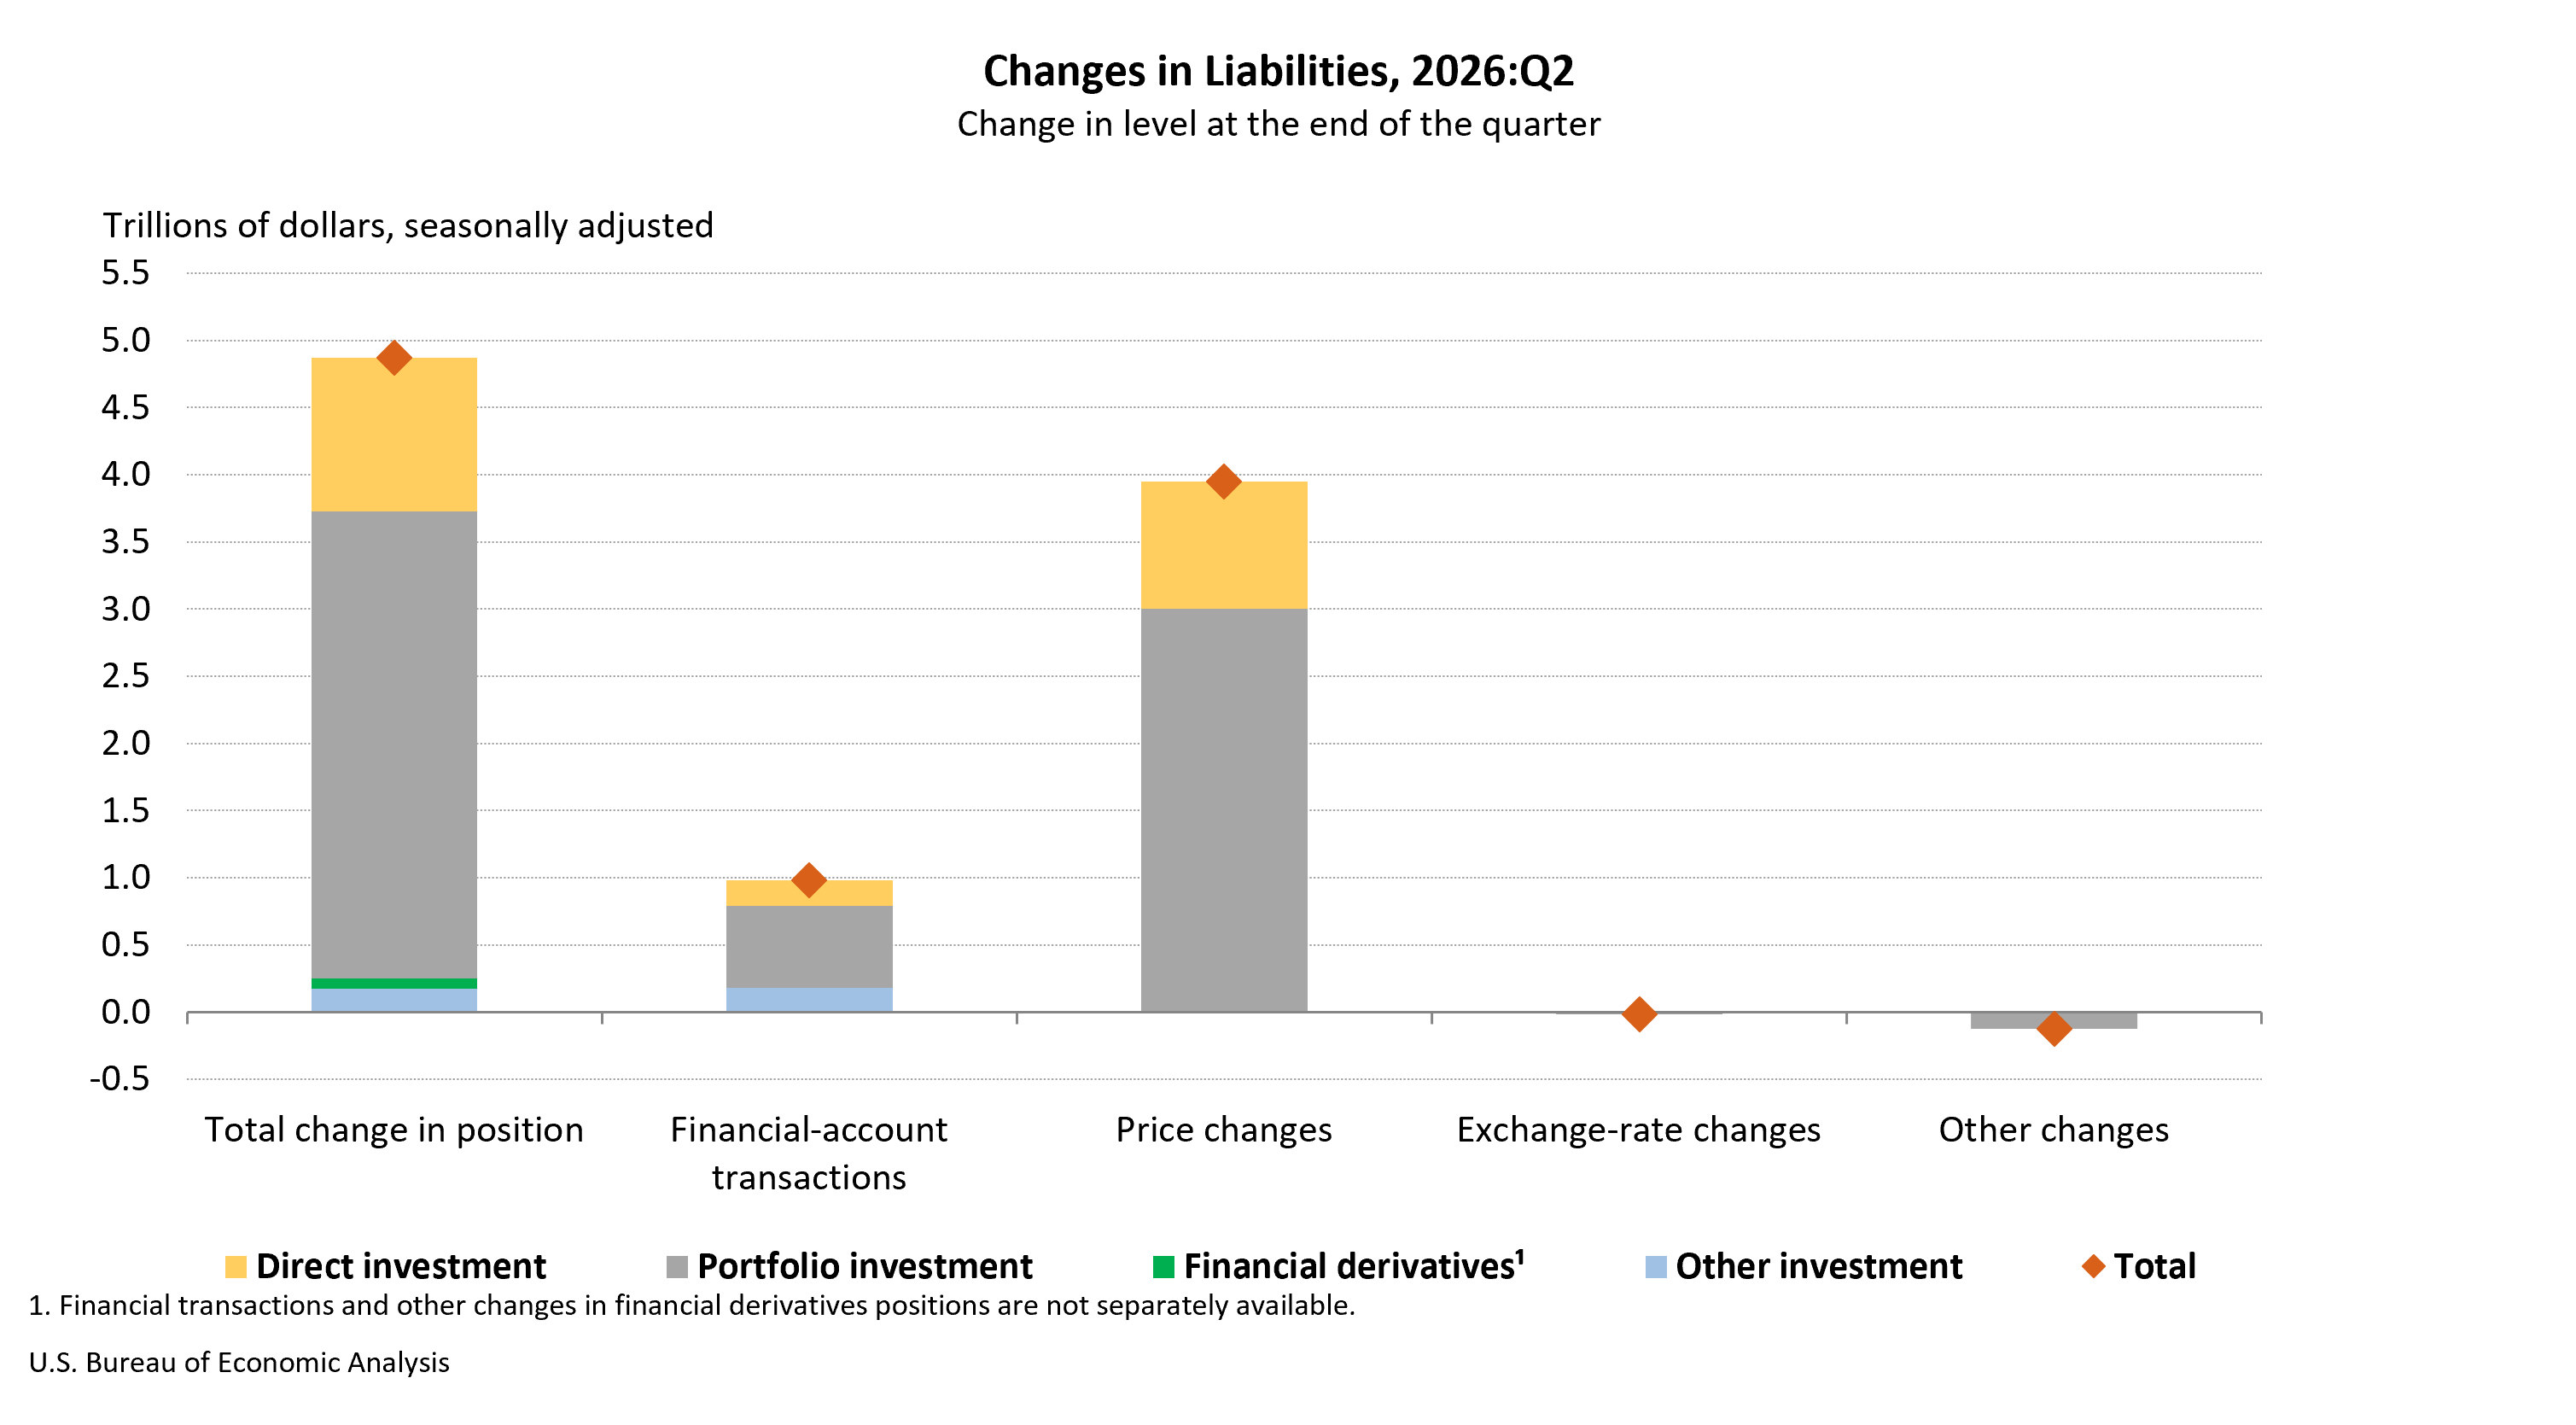
第二季度,美国负债增加4.87万亿美元,反映了所有主要投资类别的增长,尤其是证券投资。总体增长主要由价格变动带来的3.95万亿美元增量和9789亿美元的金融交易推动。
- 2026年第一季度数据更新:国际交易账户差额
- 初步估计值 · 修订估计值
- 十亿美元,经季节性调整
- 经常账户差额 · –226.8 · –212.6
- 货物贸易差额 · –250.9 · –250.9
- 服务贸易差额 · 85.1 · 92.1
- 初次收入差额 · –13.3 · –15.8
- 二次收入差额 · –47.8 · –38.0
- 金融账户交易净额 · –209.0 · –295.2
- 国际投资头寸总量指标
- 初步估计值 · 修订估计值
- 万亿美元,未经季节性调整
- 美国净国际投资头寸 · –21.27 · –21.27
- 美国资产 · 43.37 · 43.25
- 美国负债 · 64.64 · 64.52
- 美国经济分析局
相关交互式数据表
本次发布重点介绍的第二季度国际交易账户(ITA)和国际投资头寸(IIP)统计数据,以及这些估计值的历史时间序列,详见美国经济分析局(BEA)交互式数据应用程序中的以下数据表。
国际交易 表1.1 美国国际交易 表1.2 美国国际交易(扩展明细) 表2.1 美国国际货物贸易 表3.1 美国国际服务贸易 表4.1 美国初次收入国际交易 表5.1 美国二次收入国际交易 表6.1 美国直接投资国际金融交易 表7.1 美国证券投资国际金融交易 表8.1 美国其他投资国际金融交易 国际投资头寸 表1.1 期末美国净国际投资头寸 表1.2 期末美国净国际投资头寸(扩展明细) 表1.3 美国净国际投资头寸的变动
注:随着2026年第三季度国际交易账户(ITA)和国际投资头寸(IIP)统计数据于2026年12月18日发布,第二季度数据将被新数据取代,上述链接将显示最新数据。届时,可在美国经济分析局的数据档案库中获取本次发布所载的原始数据。
有关资源、定义及更多内容,请访问“补充信息”。
下次发布:2026年12月18日美国东部标准时间(EST)上午8:30 2026年第三季度美国国际交易与投资头寸
1. 金融账户交易净额等于美国净取得金融资产的金额(不包括金融衍生品)减去美国净承担负债的金额(不包括金融衍生品),再加上金融衍生品净额,并在国际交易表1.1和表1.2中列为“金融账户交易产生的净贷出(+)或净借入(–)”。
展开英文原文 · 与中文逐段对应
U.S. International Transactions and Investment Position, 2nd Quarter 2026
The U.S. current-account deficit resulting from international economic transactions widened by $33.4 billion, or 15.7 percent, to $246.0 billion in the second quarter of 2026, according to statistics released today by the U.S. Bureau of Economic Analysis. The revised first-quarter deficit was $212.6 billion.
The second-quarter deficit was 3.0 percent of current-dollar gross domestic product, up from 2.7 percent in the first quarter.
The $33.4 billion widening of the current-account deficit in the second quarter reflected an expanded deficit on goods that was partly offset by reduced deficits on primary (earned) income and on secondary income (current transfers).
Exports of goods and services to, and income received from, foreign residents increased $58.8 billion to $1.44 trillion in the second quarter, reflecting increases in goods exports and in primary (earned) income receipts.
Imports of goods and services from, and income paid to, foreign residents increased $92.2 billion to $1.69 trillion, reflecting increases in goods imports and in primary (earned) income payments.
Capital-transfer receipts decreased $1.1 billion to $2.3 billion in the second quarter. Capital-transfer payments decreased $0.9 billion to $1.0 billion.
Net financial-account transactions were –$369.7 billion in the second quarter, reflecting net U.S. borrowing from foreign residents. 1 Second-quarter transactions increased U.S. residents’ foreign financial assets by $663.3 billion and increased U.S. liabilities to foreign residents by $978.9 billion.
The U.S. net international investment position , the difference between U.S. residents’ foreign financial assets and liabilities, was –$22.42 trillion at the end of the second quarter of 2026. Assets totaled $46.97 trillion, and liabilities totaled $69.39 trillion. At the end of the first quarter of 2026, the net investment position was –$21.27 trillion (revised).
U.S. assets increased $3.72 trillion in the second quarter, reflecting increases in all major investment categories except reserve assets. The overall increase was driven by price changes of $3.03 trillion and financial transactions of $663.3 billion.
U.S. liabilities increased $4.87 trillion in the second quarter, reflecting increases in all major investment categories, particularly portfolio investment. The overall increase was driven by price changes of $3.95 trillion and financial transactions of $978.9 billion.
- Updates for the First Quarter of 2026International Transactions Accounts Balances
- Preliminary estimates · Revised estimates
- Billions of dollars, seasonally adjusted
- Current-account balance · –226.8 · –212.6
- Goods balance · –250.9 · –250.9
- Services balance · 85.1 · 92.1
- Primary income balance · –13.3 · –15.8
- Secondary income balance · –47.8 · –38.0
- Net financial-account transactions · –209.0 · –295.2
- International Investment Position Aggregates
- Preliminary estimates · Revised estimates
- Trillions of dollars, not seasonally adjusted
- U.S. net international investment position · –21.27 · –21.27
- U.S. assets · 43.37 · 43.25
- U.S. liabilities · 64.64 · 64.52
- U.S. Bureau of Economic Analysis
Related Interactive Data Tables
For the second-quarter ITA and IIP statistics highlighted in this release, as well as historical time series for these estimates, see the below data tables in BEA’s Interactive Data Application .
International transactions Table 1.1. U.S. International Transactions Table 1.2. U.S. International Transactions, Expanded Detail Table 2.1. U.S. International Trade in Goods Table 3.1. U.S. International Trade in Services Table 4.1. U.S. International Transactions in Primary Income Table 5.1. U.S. International Transactions in Secondary Income Table 6.1. U.S. International Financial Transactions for Direct Investment Table 7.1. U.S. International Financial Transactions for Portfolio Investment Table 8.1. U.S. International Financial Transactions for Other Investment International investment position Table 1.1. U.S. Net International Investment Position at the End of the Period Table 1.2. U.S. Net International Investment Position at the End of the Period, Expanded Detail Table 1.3. Change in the U.S. Net International Investment Position
Note . With the release of third-quarter 2026 ITA and IIP statistics on December 18, 2026, the second-quarter data will be superseded, and the links above will reflect the latest data. The original data featured in this release can then be accessed in BEA’s Data Archive .
For resources, definitions, and more, visit " Additional Information ."
Next release: December 18, 2026, at 8:30 a.m. EST U.S. International Transactions and Investment Position, 3rd Quarter 2026
1 . Net financial-account transactions equal net U.S. acquisition of financial assets excluding financial derivatives less net U.S. incurrence of liabilities excluding financial derivatives plus net financial derivatives and are presented in international transactions tables 1.1 and 1.2 as "Net lending (+) or net borrowing (–) from financial-account transactions."
信息从哪里来
- 美国 BEA 原始来源