2026年第二季度国内生产总值(第三次估算)、分行业国内生产总值、企业利润、各州国内生产总值和各州个人收入;2025年各州个人消费支出
GDP (Third Estimate), Industries, Corporate Profits, State GDP, and State Personal Income, 2nd Quarter 2026; State PCE, 2025
以下为原文逐段中文翻译,保留图表与说明。AI 翻译并经 AI 对照复核,仍可能存在错误;核对数据和引用时请同时查看原文。译文发布:2026年10月6日 03:30(北京时间)。
根据美国经济分析局(BEA)今日发布的第三次估算,2026年第二季度(4月、5月和6月)实际国内生产总值(GDP)按年率计算增长2.2%。第一季度实际GDP增长2.5%(修订后)。
实际GDP增速较第二次估算上调0.7个百分点,主要反映了投资、消费者支出和政府支出的上调。更多信息请参阅下文的“技术说明”。
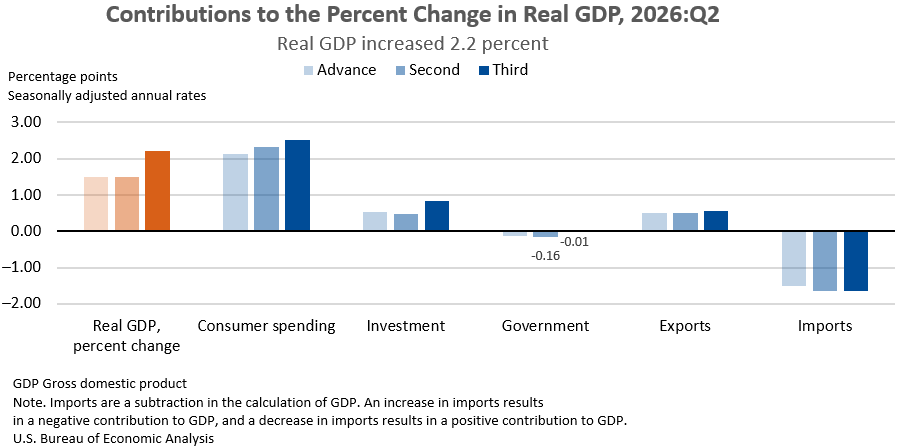
第二季度实际GDP的增长来自消费者支出、投资和出口的贡献。在GDP计算中作为减项的进口有所增加。
分行业GDP
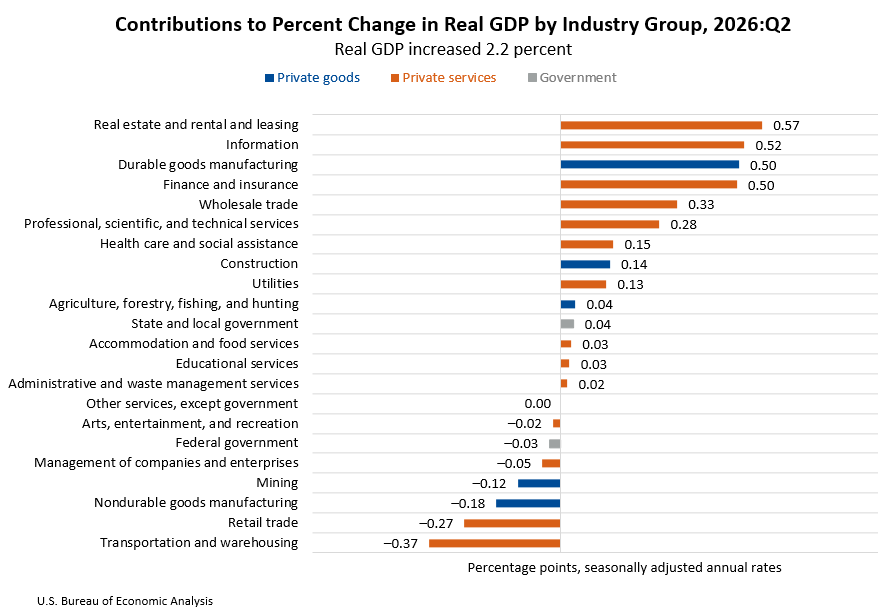
从行业角度看,实际GDP的增长反映了私营服务生产行业、私营商品生产行业和政府部门实际增加值的增长,增幅分别为2.5%、2.3%和不足0.1%。对实际GDP增长贡献最大的行业是房地产及租赁业、信息业、耐用品制造业以及金融和保险业。交通运输和仓储业、零售业以及非耐用品制造业的下降是主要抵消因素。
相关经济指标
对国内私人购买者的实际最终销售额,即消费者支出与私人固定投资总额之和,第二季度增长4.6%,较此前估算上调0.4个百分点。
第二季度实际总产出增长5.0%,反映了私营服务生产行业、私营商品生产行业和政府部门产出的增长,增幅分别为6.0%、3.0%和2.6%。
第二季度实际国内总收入(GDI)增长2.6%,较此前估算上调0.4个百分点。实际GDP与实际GDI的平均值在第二季度增长2.4%,上调0.6个百分点。
第二季度当期生产利润(经存货估值和资本消耗调整后的企业利润)增加3840亿美元,增额下调169亿美元。
第二季度国内购买总额价格指数上涨5.6%,较此前估算下调0.2个百分点。个人消费支出(PCE)价格指数上涨5.0%,下调0.3个百分点;剔除食品和能源的PCE价格指数上涨3.3%,同样下调0.3个百分点。
- 实际GDP及相关指标
- [2026年第一季度至2026年第二季度的百分比变动(SAAR)]
- 初步估算 · 第二次估算 · 第三次估算
- 实际GDP · 1.5 · 1.5 · 2.2
- 按现价美元计算的GDP · 7.9 · 8.0 · 8.5
- 对国内私人购买者的实际最终销售额 · 3.9 · 4.2 · 4.6
- 实际GDI · … · 2.2 · 2.6
- 实际GDP与实际GDI的平均值 · … · 1.8 · 2.4
- 国内购买总额价格指数 · 5.7 · 5.8 · 5.6
- PCE价格指数 · 5.1 · 5.3 · 5.0
- 剔除食品和能源的PCE价格指数 · 3.4 · 3.6 · 3.3
- SAAR:经季节性调整的折合年率。美国经济分析局
各州GDP
从地区角度看,2026年第二季度,44个州和哥伦比亚特区的实际GDP增长,按年率计算的百分比变动从纽约州的4.0%到西弗吉尼亚州的–2.3%不等。
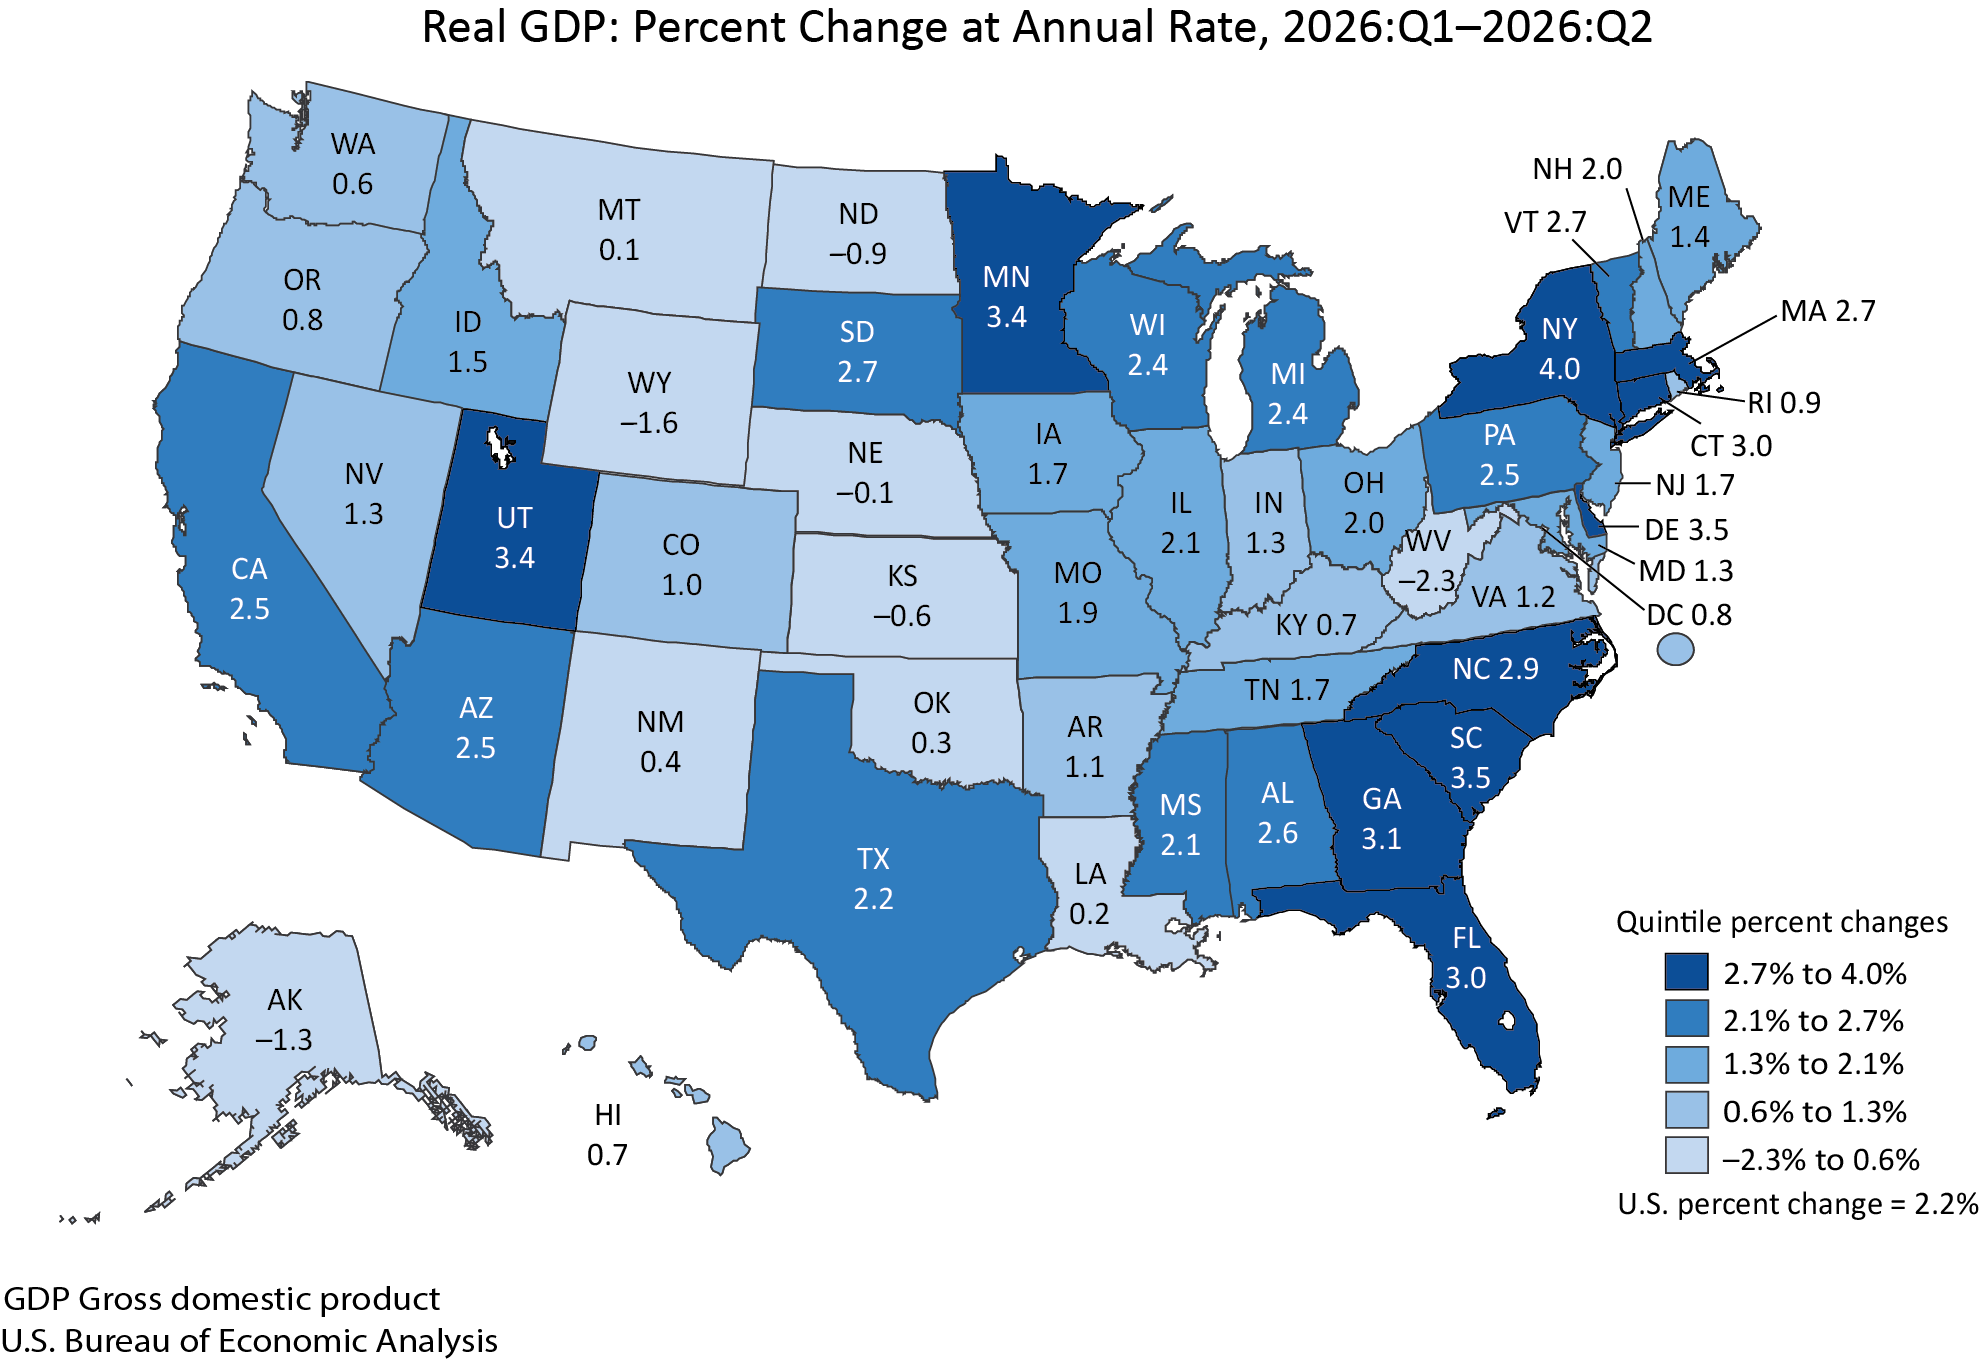
金融和保险业是纽约州和特拉华州实际GDP增长的最大贡献来源。采矿业是西弗吉尼亚州和怀俄明州实际GDP下降的主要因素。
各州个人收入
2026年第二季度,按现价美元计算的个人收入增加3143亿美元,按年率计算增长4.7%。49个州和哥伦比亚特区的个人收入增长,按年率计算的百分比变动从威斯康星州的6.4%到北达科他州的–4.2%不等。
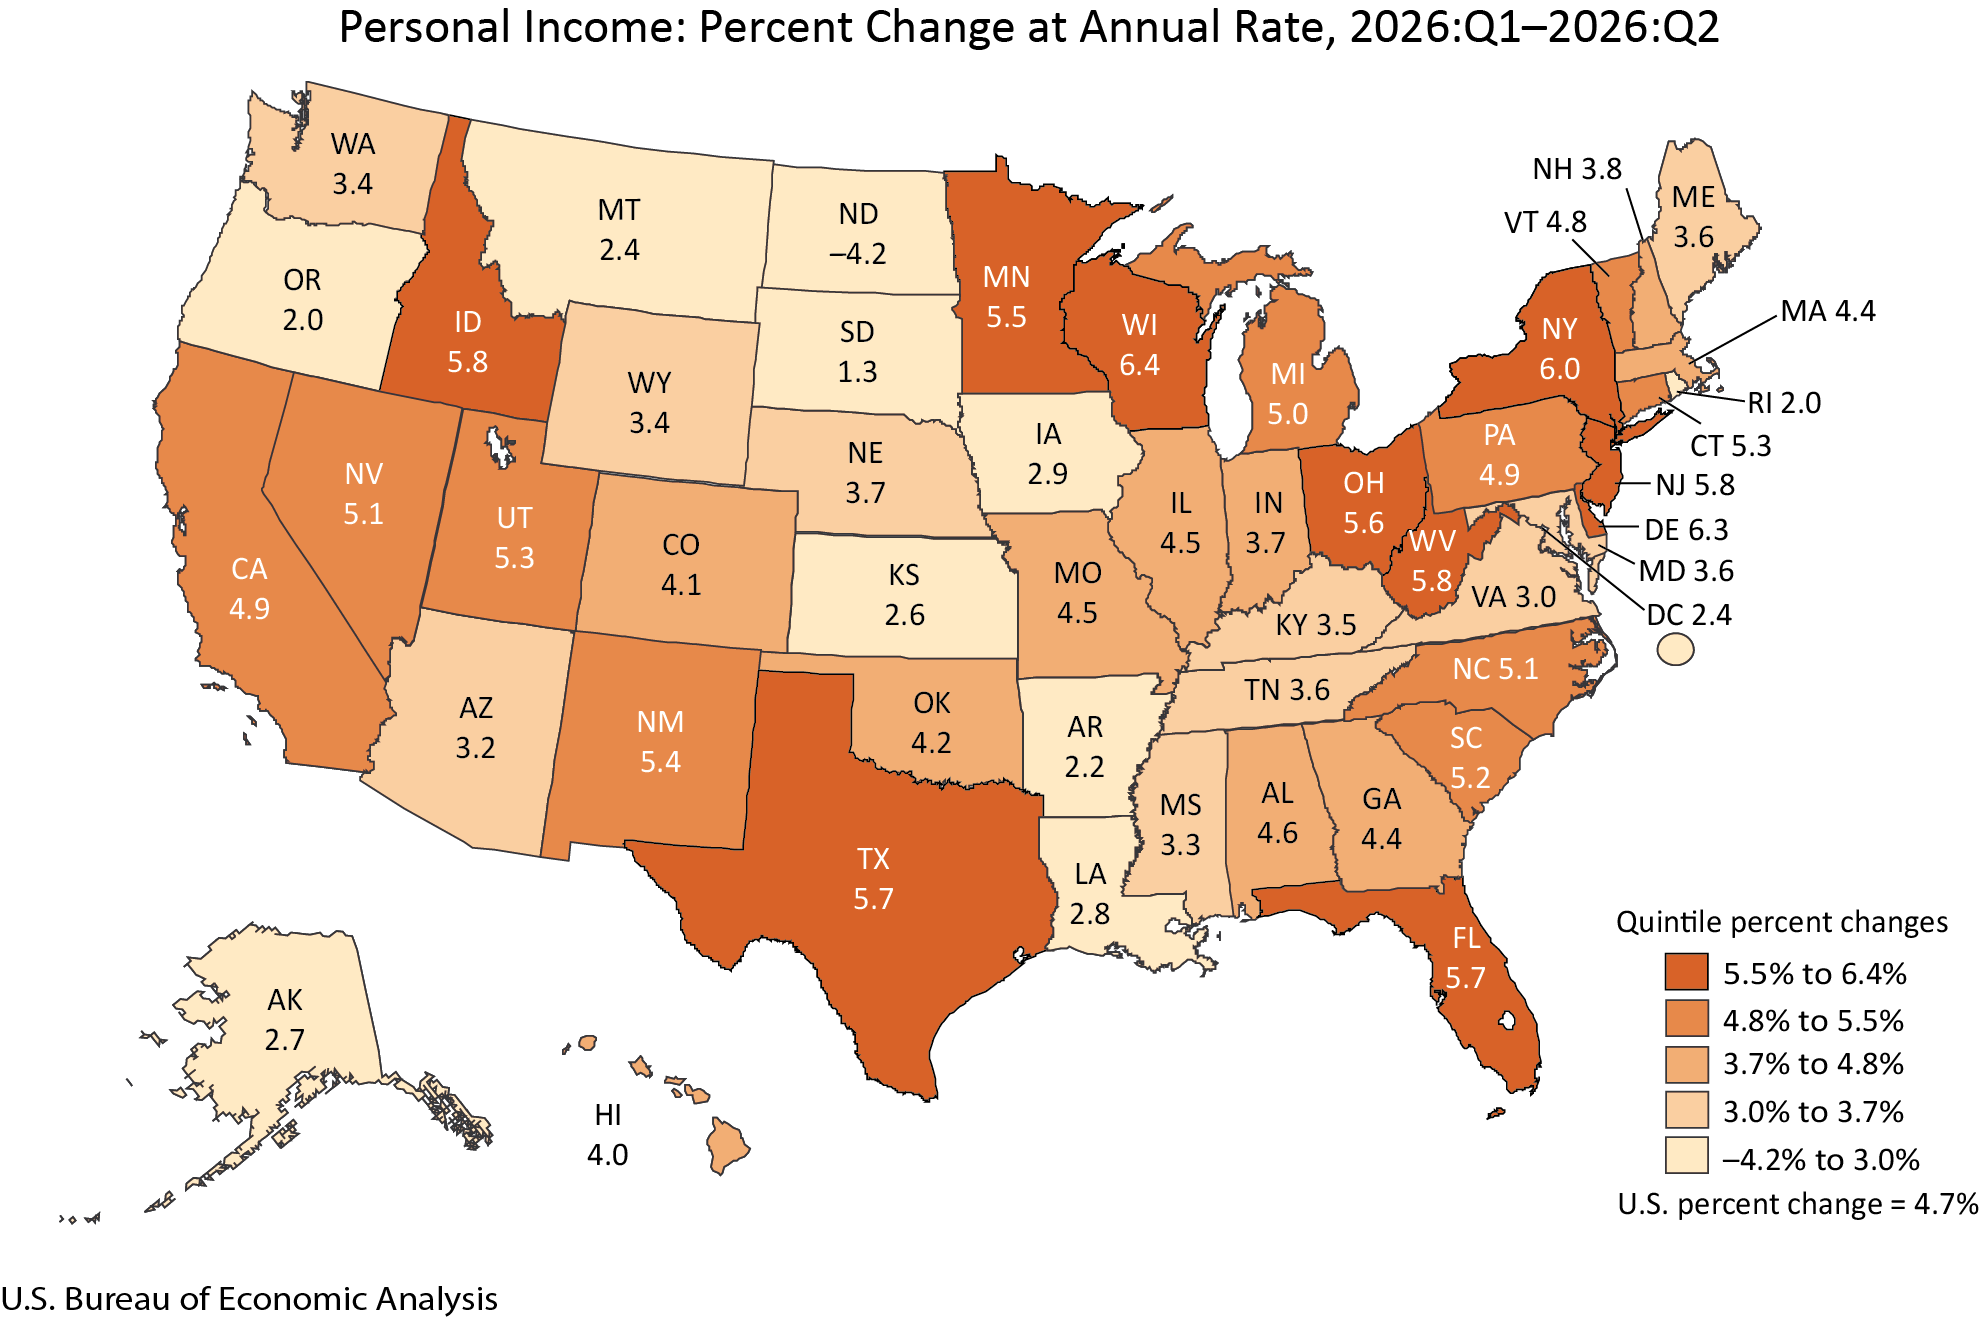
48个州和哥伦比亚特区的劳动及经营收入(雇员报酬加业主收入)增长。劳动及经营收入的百分比变动从明尼苏达州的7.3%到北达科他州的–9.3%不等。
48个州的个人经常转移收入增长,哥伦比亚特区则下降。转移收入的百分比变动从威斯康星州的13.0%到俄勒冈州的–3.9%不等。
全部50个州和哥伦比亚特区的财产收入(股息、利息和租金)均增长。百分比变动从田纳西州的5.1%到艾奥瓦州的3.3%不等。
各州个人消费支出(PCE)
2025年,按现价美元计算的PCE增长5.3%,BEA编制估算的16个主要类别中,有14个类别的支出增长。全部50个州和哥伦比亚特区的PCE均增长,百分比变动从佛罗里达州的7.0%到加利福尼亚州的4.2%不等。
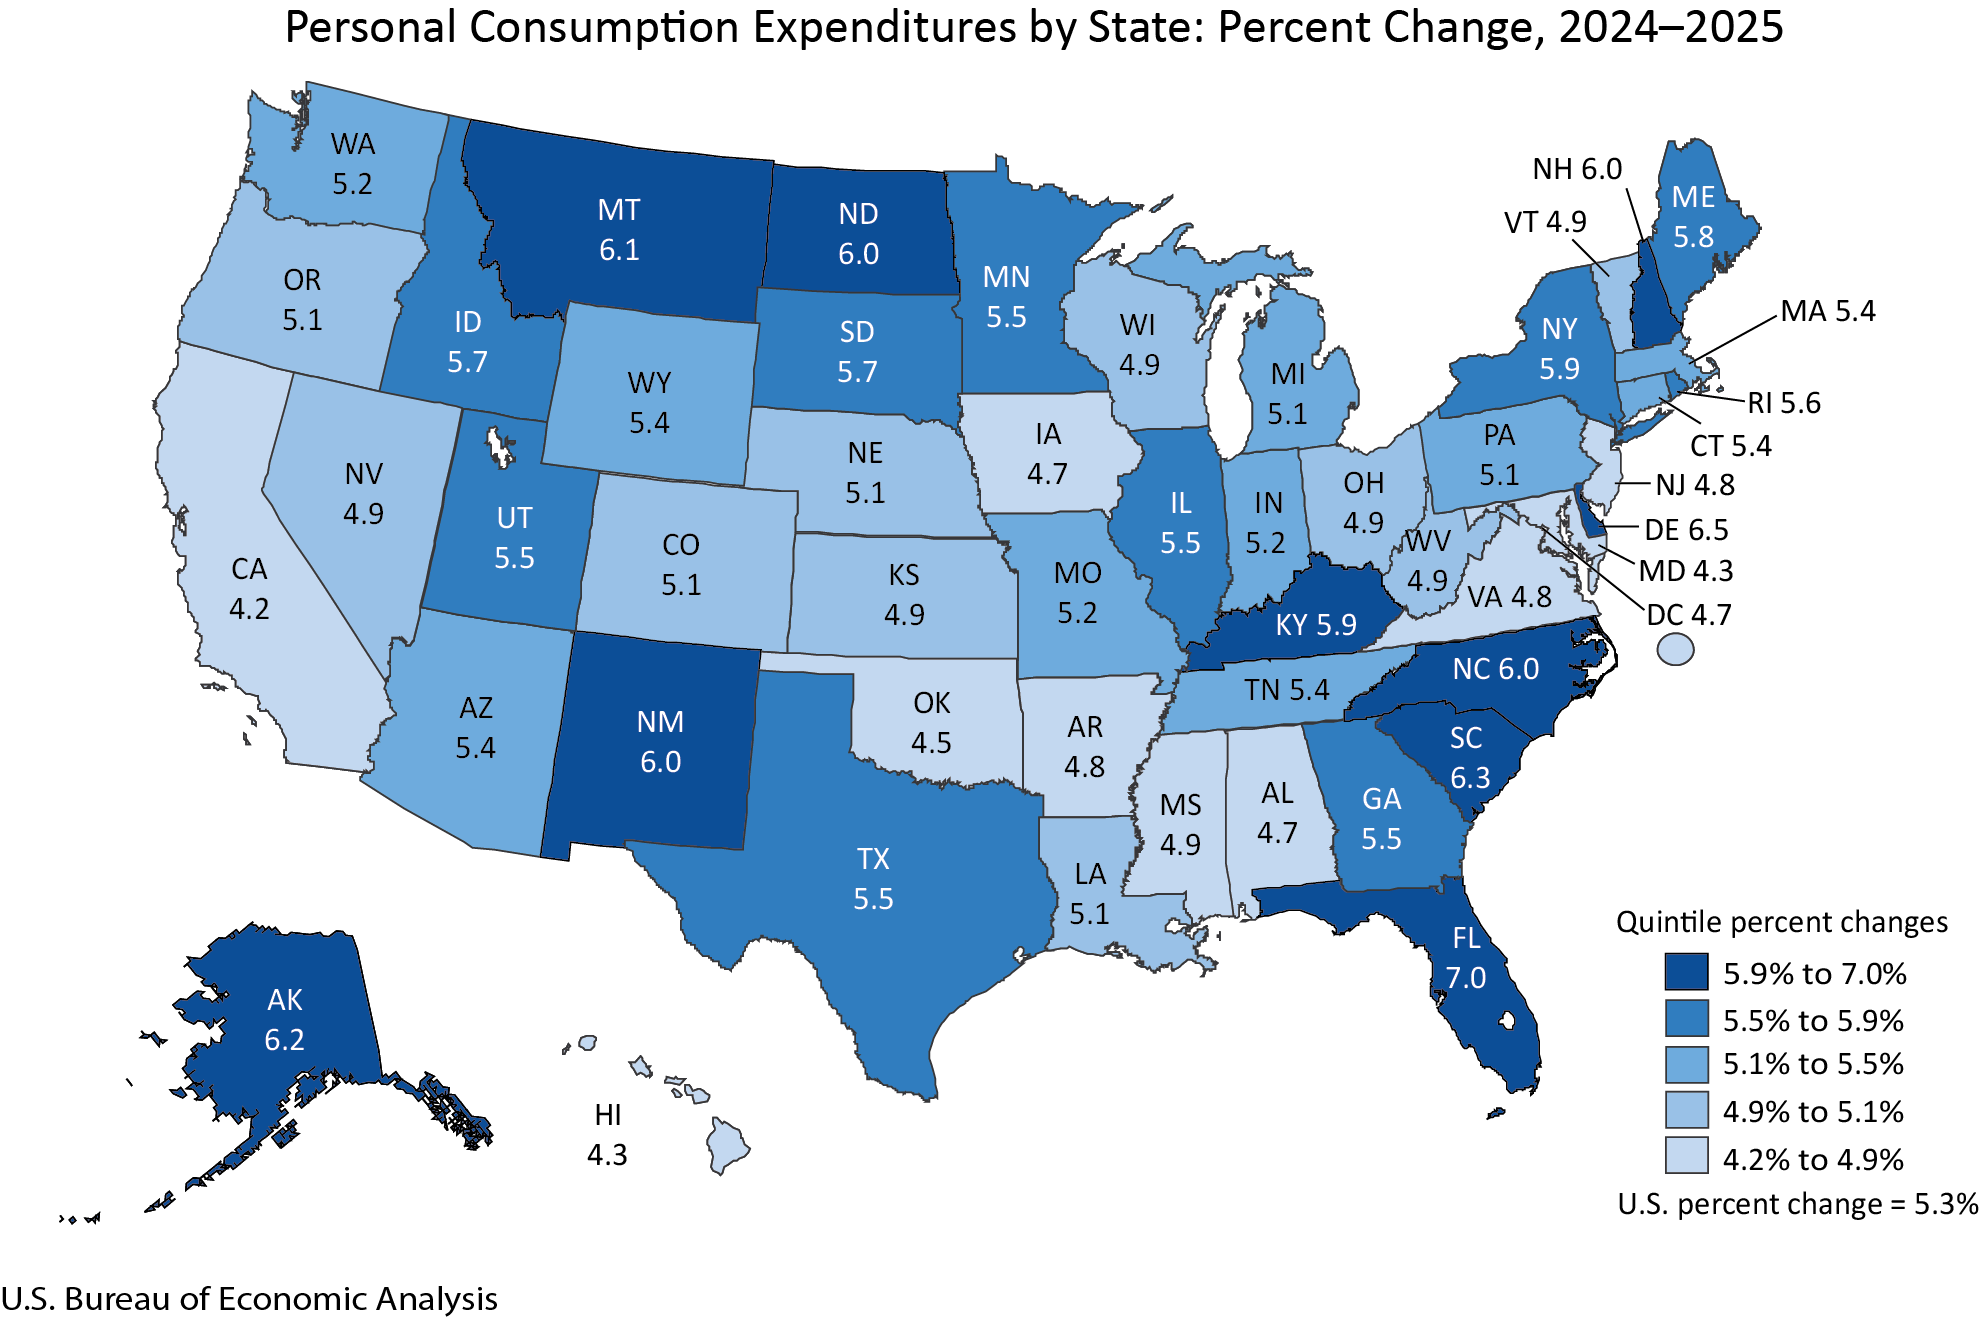
在包括佛罗里达州在内的大多数州,医疗保健以及住房和公用事业支出是PCE增长的主要贡献来源。
国民及地区经济账户年度更新
今日发布的数据还包括2026年国民经济账户年度更新的结果,国民经济账户涵盖国民收入与生产账户以及行业经济账户。此次更新覆盖2021年第一季度至2026年第一季度,对GDP、分行业GDP、GDI及其主要组成部分进行了修订。参考年份仍为2017年。今日发布的数据还包括BEA对各州GDP、各州个人收入和各州PCE进行年度更新的结果。
随着今日数据发布,大部分数据已可通过BEA网站(www.bea.gov)上的交互式数据应用获取。有关数据发布时间表,以及列示GDP、国民收入和个人收入各组成部分的现价美元数据修订、主要来源数据和概念调整的表格,请参阅《关于2026年全国、行业、州和县统计数据年度更新的信息》。更详细介绍此次更新的文章已刊登于《当前商业调查》(Survey of Current Business)。
2026年第一季度数据更新
目前估算,2026年第一季度实际GDP增长2.5%,较此前公布的估算上调0.4个百分点,主要反映了服务出口以及消费者商品和服务支出的上调。
目前估算,第一季度对国内私人购买者的实际最终销售额增长1.8%,较此前公布的估算上调0.1个百分点。
从行业角度看,目前估算第一季度私营商品生产行业的实际增加值增长1.5%,下调3.0个百分点。私营服务生产行业的实际增加值增长2.1%,上调1.3个百分点。政府部门的实际增加值增长6.3%,下调1.2个百分点。
目前估算,实际总产出增长2.3%,上调0.6个百分点。私营商品生产行业的实际总产出下降0.9%,下调0.9个百分点。私营服务生产行业的实际总产出增长2.9%,上调1.2个百分点。政府部门的实际总产出增长5.3%,上调0.4个百分点。
目前估算,第一季度国内购买总额价格指数上涨3.2%,下调0.4个百分点。PCE价格指数上涨4.2%,同样下调0.4个百分点。剔除食品和能源的PCE价格指数上涨3.9%,下调0.5个百分点。
目前估算,第一季度实际GDI增长2.5%,比此前估算高1.3个百分点。此次上调的最大贡献来自雇员报酬,主要依据美国劳工统计局(BLS)“就业与工资季度普查”项目新公布的第一季度工资和薪金数据。目前估算,第一季度实际GDP与实际GDI的平均值增长2.5%,比此前估算高0.8个百分点。
目前估算,第一季度当期生产利润(经存货估值和资本消耗调整后的企业利润)增加634亿美元,增额下调110亿美元。
- 2026年第一季度
- 此前估算 · 修订后估算
- (较上一季度的百分比变动,SAAR)
- 实际GDP · 2.1 · 2.5
- 按现价美元计算的GDP · 5.8 · 5.8
- 对国内私人购买者的实际最终销售额 · 1.7 · 1.8
- 实际GDI · 1.2 · 2.5
- 实际GDP与实际GDI的平均值 · 1.7 · 2.5
- 国内购买总额价格指数 · 3.6 · 3.2
- PCE价格指数 · 4.6 · 4.2
- 剔除食品和能源的PCE价格指数 · 4.4 · 3.9
- SAAR:经季节性调整的折合年率。美国经济分析局
有关全国统计数据的更多信息
有关各州统计数据的更多信息
下一次发布:2026年10月29日美国东部夏令时间上午8:30,2026年第三季度GDP(初步估算)。
技术说明
第三次估算中实际GDP修订的数据来源
第三次估算中实际GDP修订的数据来源:第二季度实际GDP按年率计算增长2.2%(按季度计算增长0.6%¹),上调0.7个百分点,主要反映了投资、消费者支出和政府支出的上调。有关第二季度估算所依据的来源数据和BEA假设的更多信息,见关键来源数据和假设表。
- 投资的上调反映了私人存货投资和私人固定投资均被上调。私人存货投资的修订主要反映了非农存货投资和农业存货投资的上调。非农存货投资的上调主要来自批发业;其他行业;以及采矿业、公用事业和建筑业,主要依据美国人口普查局新增和修订后的存货数据。农业存货投资的上调涉及农作物和牲畜,依据美国农业部的数据。私人固定投资修订的主要贡献来自非住宅建筑投资和住宅投资。非住宅建筑投资的修订以商业和医疗保健建筑为主,主要是数据中心,依据美国人口普查局修订后的5月和6月建筑工程完成额数据;住宅投资的修订以住宅改造为主,依据美国劳工统计局“当前就业统计”中修订后的6月住宅改造企业工资数据。
- 消费者支出的上调反映了服务支出和商品支出均被上调。在服务方面,上调主要来自娱乐服务(主要是特定观赏性娱乐活动的门票支出)和其他服务(主要是社会服务和宗教活动),依据美国人口普查局《季度服务业调查》中新获得及更新后的数据。这些上调被交通运输服务(主要是航空运输)的下调部分抵消,后者依据美国运输统计局新获得的数据。在商品方面,上调主要来自娱乐用品和车辆(主要是信息处理设备),依据美国人口普查局《月度零售贸易调查》修订后的5月和6月数据,以及更新后用于价格平减的价格指数(详情请参阅《关于2026年全国、行业、州和县统计数据年度更新的信息》)。
- 政府支出的上调主要集中在联邦国防支出(以购入的中间商品和服务为主),依据BEA更新后的国防支出季节性调整因子。
相关交互式数据表
本次发布中重点介绍的统计数据及其历史时间序列,请参阅BEA交互式数据应用中的以下数据表。
全国GDP及相关指标 表1.1.1. 实际GDP较上一期的百分比变动 表1.5.2. 对实际GDP百分比变动的贡献:扩展明细 表1.4.1. 实际GDP、实际国内购买总额及对国内购买者的实际最终销售额较上一期的百分比变动 表1.6.7. 国内购买总额价格较上一期的百分比变动 表1.7.1. 实际GDP、实际国民生产总值及实际国民生产净值较上一期的百分比变动 表6.16D. 分行业企业利润
分行业GDP 各行业增加值链式数量指数的百分比变动 各行业对实际GDP百分比变动的贡献 各行业总产出链式数量指数的百分比变动
各州GDP 表SQGDP1. 各州季度GDP——实际GDP较上一期按年率计算的百分比变动 表SQGDP11. 各行业对各州实际GDP百分比变动的贡献
各州个人收入 表SQINC1. 各州季度个人收入——较上一期按年率计算的百分比变动 表SQINC4. 各州季度个人收入——各主要组成部分的百分比变动
各州PCE 表SAPCE1. 按主要产品类型划分的PCE——较上一期的百分比变动 表SAPCE5. 各类别对各州PCE百分比变动的贡献
注:随着这些统计数据的下一次发布,今日的数据将被取代,上述链接将显示最新数据。届时,本次发布中的原始数据可通过BEA的数据档案库获取。
1. 除非另有说明,经季节性调整的季度序列的百分比变动均按年率列示。更多信息请参阅常见问题“BEA为什么按年率发布季度序列的百分比变动?”。
展开英文原文 · 与中文逐段对应
GDP (Third Estimate), Industries, Corporate Profits, State GDP, and State Personal Income, 2nd Quarter 2026; State PCE, 2025
Real gross domestic product (GDP) increased at an annual rate of 2.2 percent in the second quarter of 2026 (April, May, and June), according to the third estimate released today by the U.S. Bureau of Economic Analysis (BEA). In the first quarter, real GDP increased 2.5 percent (revised).
Real GDP was revised up 0.7 percentage point from the second estimate, primarily reflecting upward revisions to investment, consumer spending, and government spending. For more information, refer to the " Technical Notes " below
The contributors to the increase in real GDP in the second quarter were consumer spending, investment, and exports. Imports, which are a subtraction in the calculation of GDP, increased.
GDP by industry
From an industry perspective, the increase in real GDP reflected increases in real value added of 2.5 percent for private services-producing industries, 2.3 percent for private goods-producing industries, and less than 0.1 percent for government . The leading industry contributors to the increase in real GDP were real estate and rental and leasing, information, durable goods manufacturing, and finance and insurance. The leading offsets were decreases in transportation and warehousing, retail trade, and nondurable goods manufacturing.
Related economic measures
Real final sales to private domestic purchasers, the sum of consumer spending and gross private fixed investment, increased 4.6 percent in the second quarter, revised up 0.4 percentage point from the previous estimate.
Real gross output increased 5.0 percent in the second quarter, reflecting increases of 6.0 percent for private services-producing industries, 3.0 percent for private goods-producing industries, and 2.6 percent for government.
Real gross domestic income (GDI) increased 2.6 percent in the second quarter, revised up 0.4 percentage point from the previous estimate. The average of real GDP and real GDI increased 2.4 percent in the second quarter, revised up 0.6 percentage point.
Profits from current production (corporate profits with inventory valuation and capital consumption adjustments) increased $384.0 billion in the second quarter, revised down $16.9 billion.
The price index for gross domestic purchases increased 5.6 percent in the second quarter, revised down 0.2 percentage point from the previous estimate. The personal consumption expenditures (PCE) price index increased 5.0 percent, revised down 0.3 percentage point, and the PCE price index excluding food and energy increased 3.3 percent, also revised down 0.3 percentage point.
- Real GDP and Related Measures
- [Percent change (SAAR) from 2026:Q1 to 2026:Q2]
- Advance Estimate · Second Estimate · Third Estimate
- Real GDP · 1.5 · 1.5 · 2.2
- Current-dollar GDP · 7.9 · 8.0 · 8.5
- Real final sales to private domestic purchasers · 3.9 · 4.2 · 4.6
- Real GDI · … · 2.2 · 2.6
- Average of real GDP and real GDI · … · 1.8 · 2.4
- Gross domestic purchases price index · 5.7 · 5.8 · 5.6
- PCE price index · 5.1 · 5.3 · 5.0
- PCE price index excluding food and energy · 3.4 · 3.6 · 3.3
- SAAR seasonally adjusted at annual ratesU.S. Bureau of Economic Analysis
GDP by state
From a regional perspective, real GDP increased in 44 states and the District of Columbia in the second quarter of 2026, with the percent change at an annual rate ranging from 4.0 percent in New York to –2.3 percent in West Virginia.
Finance and insurance was the leading contributor to the increase in real GDP in New York and Delaware. Mining was the leading contributor to the decrease in West Virginia and Wyoming.
Personal income by state
In the second quarter of 2026, current-dollar personal income increased $314.3 billion, or 4.7 percent at an annual rate. Personal income increased in 49 states and the District of Columbia, with the percent change at an annual rate ranging from 6.4 percent in Wisconsin to –4.2 percent in North Dakota.
Earnings (compensation plus proprietors’ income) increased in 48 states and the District of Columbia. The percent change in earnings ranged from 7.3 percent in Minnesota to –9.3 percent in North Dakota.
Personal current transfer receipts increased in 48 states and declined in the District of Columbia. The percent change in transfer receipts ranged from 13.0 percent in Wisconsin to –3.9 percent in Oregon.
Property income (dividends, interest, and rent) increased in all 50 states and the District of Columbia. The percent change ranged from 5.1 percent in Tennessee to 3.3 percent in Iowa.
Personal consumption expenditures (PCE) by state
In 2025, current-dollar PCE increased 5.3 percent, increasing in 14 of the 16 major categories for which BEA prepares estimates. PCE by state increased in all 50 states and the District of Columbia, with the percent change ranging from 7.0 percent in Florida to 4.2 percent in California.
Health care and housing and utilities were the leading contributors to the increases in PCE in most states, including Florida.
Annual Update of the National and Regional Economic Accounts
Today's release also includes results from the 2026 annual update of the National Economic Accounts, which include the National Income and Product Accounts and the Industry Economic Accounts. The update covered the first quarter of 2021 through the first quarter of 2026 and resulted in revisions to GDP, GDP by industry, GDI, and their major components. The reference year remains 2017. Today’s release also includes the results of BEA's annual updates of GDP by state, personal income by state, and PCE by state.
With today's release, most data are available through BEA's Interactive Data application on the BEA website ( www.bea.gov ). Refer to " Information on 2026 Annual Updates to the National, Industry, State, and County Statistics " for the data availability schedule and a table showing current-dollar revisions, major source data, and conceptual changes for components of GDP, national income, and personal income. An article describing the update in more detail is posted in the Survey of Current Business .
Updates for the First Quarter of 2026
For the first quarter of 2026, real GDP is now estimated to have increased 2.5 percent , an upward revision of 0.4 percentage point from the previously published estimate, primarily reflecting upward revisions to exports of services and consumer spending on both goods and services.
Real final sales to private domestic purchasers is now estimated to have increased 1.8 percent in the first quarter, an upward revision of 0.1 percentage point from the previously published estimate.
From an industry perspective, real value added for private goods-producing industries is now estimated to have increased 1.5 percent in the first quarter, a downward revision of 3.0 percentage points. Private services-producing industries increased 2.1 percent, an upward revision of 1.3 percentage points. Government increased 6.3 percent, a downward revision of 1.2 percentage points .
Real gross output is now estimated to have increased 2.3 percent , an upward revision of 0.6 percentage point. Private goods-producing industries decreased 0.9 percent, a downward revision of 0.9 percentage point. Private services-producing industries increased 2.9 percent, an upward revision of 1.2 percentage points. Government increased 5.3 percent, an upward revision of 0.4 percentage point.
The price index for gross domestic purchases is now estimated to have increased 3.2 percent in the first quarter, a downward revision of 0.4 percentage point. The PCE price index increased 4.2 percent, also revised down 0.4 percentage point. Excluding food and energy, the PCE price index increased 3.9 percent, revised down 0.5 percentage point.
Real GDI is now estimated to have increased 2.5 percent in the first quarter, 1.3 percentage points higher than previously estimated. The leading contributor to the upward revision was compensation, based primarily on new first-quarter wage and salary data from the U.S. Bureau of Labor Statistics’ (BLS) Quarterly Census of Employment and Wages program. The average of real GDP and real GDI is now estimated to have increased 2.5 percent in the first quarter, 0.8 percentage point higher than previously estimated.
Profits from current production (corporate profits with inventory valuation and capital consumption adjustments) is now estimated to have increased $63.4 billion in the first quarter, a downward revison of $11.0 billion.
- First Quarter 2026
- Previous Estimate · Revised Estimate
- (Percent change (SAAR) from preceding quarter)
- Real GDP · 2.1 · 2.5
- Current-dollar GDP · 5.8 · 5.8
- Real final sales to private domestic purchasers · 1.7 · 1.8
- Real GDI · 1.2 · 2.5
- Average of real GDP and real GDI · 1.7 · 2.5
- Gross domestic purchases price index · 3.6 · 3.2
- PCE price index · 4.6 · 4.2
- PCE price index excluding food and energy · 4.4 · 3.9
- SAAR seasonally adjusted at annual ratesU.S. Bureau of Economic Analysis
additional information about national statistics
additional information about state statistics
Next release: October 29, 2026, at 8:30 a.m. EDT GDP (Advance Estimate), 3rd Quarter 2026
Technical Notes
Sources of revisions to real GDP in the third estimate
Sources of revision to real GDP in the third estimate Real GDP increased at an annual rate of 2.2 percent (0.6 percent at a quarterly rate 1 ) in the second quarter, an upward revision of 0.7 percentage point, primarily reflecting upward revisions to investment, consumer spending, and government spending. More information on the source data and BEA assumptions that underlie the second-quarter estimate is shown in the key source data and assumptions table .
- The upward revision to investment reflected upward revisions to both private inventory investment and private fixed investment.The revision to private inventory investment primarily reflected upward revisions to nonfarm inventory investment (led by wholesale trade; other industries; and mining, utilities, and construction), primarily based on new and revised U.S. Census Bureau inventory data, and farm inventory investment (both crops and livestock), based on data from the U.S. Department of Agriculture.The leading contributors to the revision to private fixed investment were nonresidential structures (led by commercial and health care, mainly data centers), based on revised U.S. Census Bureau Value of Construction Put in Place data for May and June, and residential investment (led by improvements), based on revised June remodelers' payroll data from the BLS Current Employment Statistics.
- The upward revision to consumer spending reflected upward revisions to services and goods.Within services, the upward revision was led by recreation services (mainly admissions to specified spectator amusements) and other services (mainly social services and religious activities), based on newly available and updated data from the U.S. Census Bureau’s Quarterly Services Survey. These upward revisions were partly offset by a downward revision to transportation services (mainly air transportation), based on newly available data from the Bureau of Transportation Statistics.Within goods, the upward revision was led by recreational goods and vehicles (mainly information processing equipment), based on revised U.S. Census Bureau Monthly Retail Trade Survey data for May and June as well as an updated price index used for deflation (refer to "Information on 2026 Annual Updates to the National, Industry, State, and County Statistics" for details).
- The upward revision to government spending was mainly to federal defense (led by intermediate goods and services purchased), based on updated BEA seasonal adjustment factors for defense spending.
Related Interactive Data Tables
For the statistics highlighted in this release, as well as historical time series for these statistics, see the below data tables in BEA’s interactive data application .
National GDP and related measures Table 1.1.1. Percent Change From Preceding Period in Real GDP Table 1.5.2. Contributions to Percent Change in Real GDP, Expanded Detail Table 1.4.1. Percent Change From Preceding Period in Real GDP, Real Gross Domestic Purchases, and Real Final Sales to Domestic Purchasers Table 1.6.7. Percent Change From Preceding Period in Prices for Gross Domestic Purchases Table 1.7.1. Percent Change From Preceding Period in Real GDP, Real Gross National Product, and Real Net National Product Table 6.16D. Corporate Profits by Industry
GDP by industry Percent Changes in Chain-Type Quantity Indexes for Value Added by Industry Contributions to Percent Change in Real GDP by Industry Percent Changes in Chain-Type Quantity Indexes for Gross Output by Industry
GDP by state Table SQGDP1. Quarterly GDP by State—Percent Change at Annual Rates From Preceding Period in Real GDP Table SQGDP11. Industry Contributions to Percent Change in Real GDP by State
Personal income by state Table SQINC1. Quarterly Personal Income by State—Percent Change at Annual Rates From Preceding Period Table SQINC4. Quarterly Personal Income by State—Percent Change by Major Component
PCE by state Table SAPCE1. PCE by Major Type of Product—Percent Change From Preceding Period Table SAPCE5. Category Contributions to Percent Change in PCE by State
Note. With the next releases of these statistics, today’s data will be superseded, and the links above will reflect the latest data. The original data featured in this release can then be accessed in BEA’s Data Archive .
1. Percent changes in quarterly seasonally adjusted series are displayed at annual rates, unless otherwise specified. For more information, refer to the FAQ “ Why does BEA publish percent changes in quarterly series at annual rates? ”.
信息从哪里来
- 美国 BEA 原始来源